![[Industrial IoT] Tower Analytics](http://www.cgvenkateshrajulabs.com/wp-content/uploads/2020/04/unnamed-1-1.jpg)
[Industrial IoT] Tower Analytics
Problem Statement:-
Millions of dollars are lost every year due to misaligned antennas in cellular towers. The roll-out of 5G means that this labour-intensive problem is only going to get worse over time.
Cellular Tower Antenna Monitoring solution will save cell companies a huge amount of money on unnecessary callout fees.
The demand for uninterrupted service means that cell companies have to err on the side of caution every time they think that a cell tower antenna may be misaligned. This results in engineers being called out to perform high-risk, expensive and potentially-unnecessary maintenance checks.
CTAM uses the IoT platform to provide real-time data and predictive insights for preventative maintenance of high-alert sites, eliminating the guesswork around call-outs. It can also offer line-of-sight monitoring of any obstacles around the towers that could cause potential disruptions.
When transposed onto a national network, IOT monitoring solution will save cell companies enormous amounts of time and money.
Our Antenna Alignment Sensor can monitor antenna positions for RF panel, DAS, and small cell antennas and provide an alert for any movement due to weather, seismic or other physical events.
Accurate and timely reporting of alignment issues minimizes the amount of time networks are impaired or off-line. Targeted repairs decrease overall maintenance costs by preventing unnecessary truck rolls which in turn also improves network uptime and customer satisfaction reducing customer churn.
The Antenna Alignment Sensor system is not limited to monitoring antenna alignment, with applications for monitoring the alignment of devices well beyond the telecommunications world. Monitoring of alignment for critical high availability QoS systems is extremely important for utility, transportation and emergency services, as well as commercial telecommunications. The IoT Antenna Alignment Sensor offers a cost effective and practical solution for those critical industries.
The Antenna Alignment Sensor is the least expensive, easiest to maintain alignment monitoring system ever developed. There are no per-site controllers or other equipment to deploy, no cabling, no configuring Wi-Fi, no Ethernet, no managing IP addresses, no external controller antennas, no Windows-based controller software, and no local power requirement – just one battery powered sensor mounted on the monitored device.
The Antenna Alignment Sensor can be installed in just three easy steps.
- Attach sensor to antenna to be monitored using included two-sided construction-quality mounting tape (peel and stick)
- Power on the battery-operated sensor. Sensor starts to report to the cloud immediately.
- Login to cloud account to activate the sensor (provide the site, sector and antenna name)
Once the sensor is activated, we can:
- Manage sensors in groups or individually (example: view by region or network)
- Set alarm thresholds for reporting, by sensor or by group
- Configure reporting methods and technologies (email, text, SNMP, etc.)
- Alarms, Measurements, and Reports delivered automatically!
- The aggregated cloud data can be retrieved or pushed to the end user based on user-configurable parameters.
- Measures azimuth, latitude/longitude, tilt, roll (plumb), MSL height, and AGL height
- Produce PDF, CSV and Google Earth reports for closeout packages that are accepted and/or required by all carriers.
- Photo report feature to add multiple pictures to report. Pictures will contain alignment information embedded directly on the photograph
Use/Cases:-
- Wind turbines and solar arrays.
- Telecom micro/macro towers
- Align multiple aerospace and defense products
- Ground/Rail transportation (Heavy equipments)
Basic Architecture
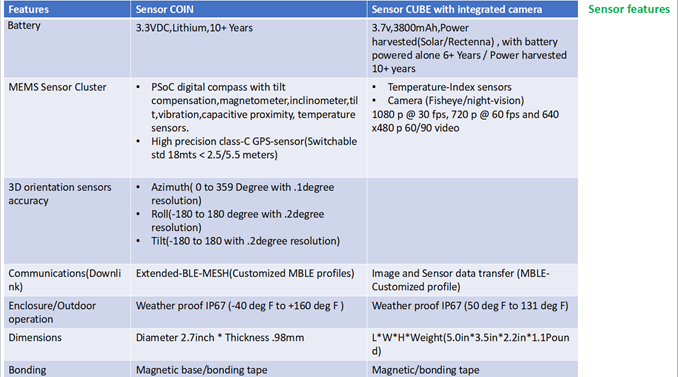
Two types of sensors are used to monitor site physical RF antenna alignment characteristics.
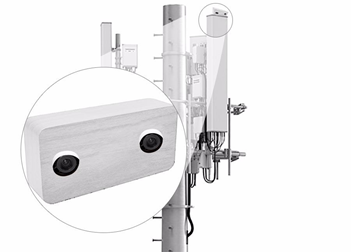

Above illustration shows two types of sensors and their mounting locations/positions , Sensor-COIN; Sensor-CUBE(with integrated camera). Sensor-COIN mesh-BLE sensor comprises of PSoC digital compass with tilt compensation,magnetometer,inclinometer,tilt,vibration,capacitive proximity, temperature sensors and a high precision class-C GPS-sensor(Switchable std 18mts < 2.5/5.5 meters)
Sensor-CUBE sensor comprises of Temperature-Index sensors with Camera (Fisheye/night-vision)1080 p @ 30 fps, 720 p @ 60 fps and 640 x480 p 60/90 video capability.
The architecture for distributed sensor cluster monitoring at the initial stage is presented in the figure below.
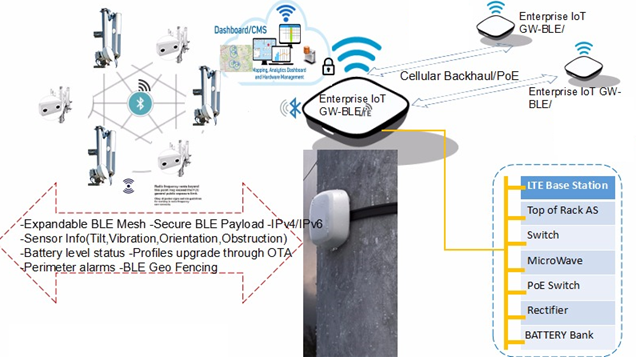
After distributed sensors and IoT-gateway installation for each site the sensor-associated antennas start on-boarding through pre-provisioning framework driven either through on-prem/data-processing orchestrated server.
Mesh-BLE state machine gets kicked off and BLE link establishment sequences start off followed by successful registration and reach-ablity with the data-processing server. IoT gateway downlink is always governed by MBLE and uplink through gigabit PoE when PoE data-channel link is not available then gateway gets the power PoE port and all data gets transferred through LTE backhaul.
Proposed platform cloud scaleablity is built on top of openStack PaaS+SaaS enables easy vertical and horizontal scaling manages more than 90,000+ sensor connections at a time.
All IoT gateways are cloud auto-synced at every 1-minute interval as heartbeat , NTP-sync between distributed sensor at sites to IoT GW and all the way till cloud orchestration takes care of assured IP-SLA metrics.
Sensor data transfer happens through secure configurable security polices set on the configuration dashboard , UPLINK data can be transferred to the cloud either through standard JWT token based RESTFUL JSON or through encrypted MqTT formats.
Sensor tower dashboard
Dashboard gives the complete view of the real-time statistics of any installed tower upon clicking the the GPS listed pinout.
Real-time streams of the sensor cluster data are translated in to tower metrics and the plots show the threshold Vs delta deviations and its occurrence time-stamp.
Tower-details window gives complete details about tower location,site-ID information,marked perimeter fencing details
Mapping view window gives details about deviated tower information , 2-level clicks gives the location co-ordinates mapping/street views zooming attributes are controlled through fusion layer (combination of GPS-engine+API-serviceablity)
Battery level window shows the status of the on-board battery levels of the specified tower (Sensor dots coin batteries,sensor-cam lithum-ion)
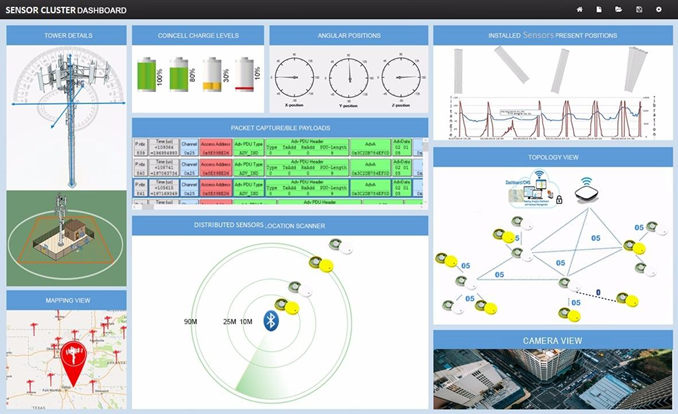
Angular positions/Installed sensor positions window reveal the three dimensional orientation delta-effect encountered by the antenna mounted sensors
– Antenna Tilt angles with 0.1 degree resolution (angle of forward bend of the antenna with respect to the vertical axis of the mounting pole)
– Antenna Azimuth with 0.1 degree resolution(orientation angle of the antenna with respect to the North direction)
– Antenna Roll with 0.1 degree resolution(angle of its vertical axis relative to an ideal vertical plumb to the ground)
BLE Mesh Scanner window gives complete capture and dump of the sensor-encoded BLE payloads and their mesh connection states,mesh-link quality all these detail can found by the click of scan button.
Topology window gives out the topology in which the sensor nodes are connected and the BLE payload aggregation point , routing of the BLE payloads. Topology view also gives metrics about the up-link metrics(PoE/mobile back-haul) upon mouse-over the links.
Camera view shows the focused line-of-sight images for each antenna is being aligned to , openGL grid-view cross-markers canvas on the dashboard will be able to tell through X-Markers deviation levels.Upon encountering partial/full scale obstruction automated markers upon becoming invisible(due to New building constructions, growing tree lines, advertisement gas balloons,etc..) sensor-cam will start taking pictures and automatically sync-up with IoT gateway and the images from there are streamed on to the mapped server every 1-minute heartbeat interval.
Connectivity
Sensor-Coins,Sensor-cube cam communicate with the IoT gateway through mesh-BLE uplink and between sensors the communication happens through secure custom defined BLE-mesh-profile(mesh-connect). Mesh enabled BLE sensors with +20dB power amplification is able to extended communication min 200+ feet and max of 750 feet.
Communication between IoT gateway to cloud can happen through two interfaces either through PoE or though mobile back-haul , link-quality is accessed before initiating aggregated data-transfer from IoT Gateway to the cloud.
When the uplink connectivity between IoT-Gateway and the cloud is lost data is not lost the internal-DB starts logging the data and once the connectivity restores through auto-sync mechanism the data gets updated to the cloud hosted server DB without any data loss.
Sensor Monitoring Work Flow
Below sensor monitoring work-flow briefs the sequence of events that happen right from powering on the sensor mounted antennas till its course correction

First step device discovery session happens between sensor mounted antennas and the IoT gateway through pre-provisioning process , gateway running internal DHCPv6 server gives out ipv6 address to the sensor nodes. IoT gateway simultaneously checks it s uplink connectivity status and once available then EAP-TLS based data transfer sequence is initiated .
Cloud connector points then try to checks for the secure port connections and once the control command is received opens the port for the specified duration and fills in the buffer with payloads and opens-up the connection
Secure tunnel based data-streaming tunnel connection is established , once the registration and connection success events hits the FULL-STACK framework , GUI configured site monitoring parameters markers are pushed to the sensor nodes and once the sensor nodes receive these configuration , sensor fusion monitoring firmware handlers kick-in and starts full-fledged three-dimensional sensor orientations monitoring and streams sensor events in real time through secure tunnel.
Data classifications happen at the back-end and simultaneously tower analytics engine starts consuming the data through another pipe and data-sets get trained over period of time and over centralized dashboard showup present data and predictive data plots
Product Specifications