

AI-Driven Environmental Intelligence & Predictive Assurance for Modern Infrastructure
DCEWS (Data Center Early Warning System) is a next-generation, AI-powered observability and predictive assurance platform for data centers, telecom edge sites, and other mission-critical environments. Designed for high-performance operations, DCEWS unifies thermal mapping, computer vision, particulate sensing, anomaly detection, and on-prem LLM analytics to deliver real-time visibility, proactive risk mitigation, and autonomous decision support. Leveraging edge-native processing, zero cloud dependency, and modular sensor intelligence, it provides a comprehensive early-warning layer that detects thermal hotspots, airflow deviations, particulate anomalies, and perimeter or POD-access events while autonomously generating RCA insights and health reports.
Built to overcome the complexity, latency, and blind spots of traditional DCIM tools, DCEWS delivers proactive thermal intelligence, continuous environmental monitoring, predictive analytics, automated health reporting, and computer-vision–based physical oversight all while preserving data sovereignty.
As a result, it helps prevent unplanned outages, reduce operational costs, strengthen physical security, improve SLA adherence, streamline operations, and enhance overall resilience, transforming traditional monitoring into predictive, autonomous infrastructure intelligence that enables organizations to operate and scale with confidence.
Table of Contents
- Introduction
- Key Features
- System Architecture
- Technology Stack
- Product Benefits
- Why Choose DCEWS?
- Use Cases
- Way forward
📘 Introduction
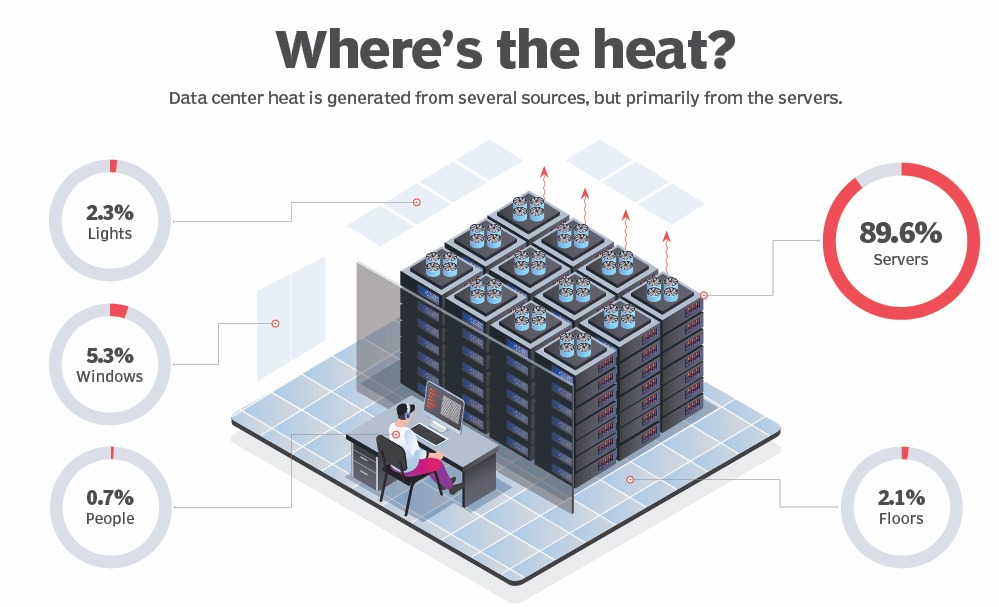
As network processing power increases, maintaining optimal equipment temperatures has become more challenging due to higher processor densities and rising heat levels. Excessive heat can lead to equipment failure and costly downtime, making efficient cooling systems critical. Since nearly all power consumed by processors is converted to heat, data centers must effectively deliver cold air to equipment intakes and remove hot exhaust to ensure continuous operation and network availability.
Effective power, cooling, and airflow management are essential to prevent data center equipment failure and ensure reliable operation. Since nearly all incoming power converts to heat, maintaining temperatures below 80˚ to 85˚F is critical to avoid overheating. Exceeding this range triggers thermal protection, reducing processing power or shutting down equipment to prevent damage. Prolonged exposure to elevated temperatures can decrease reliability and shorten equipment lifespan, emphasizing the importance of efficient thermal management.
The increasing number of data centers and the high heat density of IT equipment have made energy-efficient thermal management a critical research focus. Localized hybrid air-water cooling offers a targeted solution to address varying heat dissipation levels across racks, unlike traditional air cooling, which often requires over-provisioning. In a closed hybrid air-water cooled server cabinet, heat is removed through a self-contained system, independent of room-level cooling. This study experimentally characterizes a hybrid-cooled enclosed cabinet and its internal components in steady-state conditions. A cabinet-level model was developed to simulate various operational scenarios, including air leakage effects. Additionally, the impact of cooling system failures on IT performance was analyzed, and the time taken for IT equipment to exceed standard temperature thresholds under failure conditions was compared.
Energy-efficient cooling is essential for modern data centers due to increasing heat loads. A hybrid air-water cooling approach offers precise control compared to traditional air cooling, which often leads to inefficiencies. In this study, a closed hybrid-cooled cabinet was tested to analyze its performance under steady-state conditions and simulated failure scenarios. The findings provide insights into air leakage effects and the response time of IT equipment to cooling failures, highlighting the potential benefits and reliability of hybrid cooling systems.
The Critical Role of Data Center Temperature Monitoring in Enhancing Storage Device Longevity and Performance
Effective temperature monitoring within data centers is universally recognized as an essential practice to optimize server performance and extend the lifespan of critical IT infrastructure. Maintaining optimal environmental conditions is of paramount importance, as temperature fluctuations—especially elevated heat levels—can result in severe consequences, including data loss and hardware failure. Therefore, data center administrators must place a strong emphasis on comprehensive environmental monitoring, particularly temperature control, to ensure operational continuity and reliability.
This article delves into the intricate relationship between temperature and IT storage systems, with a primary focus on two commonly used storage technologies: Hard Disk Drives (HDDs) and Solid State Drives (SSDs). Both of these storage solutions are highly sensitive to temperature variations, which can impact their reliability, operational efficiency, and long-term data retention capabilities. By understanding these thermal impacts and adopting robust temperature monitoring solutions, data centers can proactively manage risks and enhance overall infrastructure resilience.
The Adverse Effects of Temperature Extremes on Storage Devices Hard drives operating outside their optimal temperature range are susceptible to a variety of mechanical and electrical complications. Excessively high or low temperatures can lead to issues such as head misalignment, condensation, and circuit board failures. Interestingly, overcooling hard drives may paradoxically increase failure rates compared to drives running at moderately elevated temperatures, a finding supported by extensive research in the field.
Studies indicate that elevated temperatures can significantly reduce the operational lifespan of hard drives. For instance, research has shown that even a slight increase of 5°C (9°F) in temperature can shorten a hard drive’s lifespan by up to two years.
Temperature-induced performance degradation is another critical concern. Modern hard drives incorporate protective mechanisms that throttle read and write speeds once temperatures exceed a critical threshold, typically around 60°C (140°F). Under such conditions, performance can degrade dramatically—sometimes dropping to speeds as low as 1 MB/s—until the drive returns to a safe operating temperature.
To maintain optimal hard drive performance, experts recommend an operational temperature range of 20°C (68°F) to 45°C (113°F), which balances efficiency and longevity.
Factors Leading to High Hard Drive Temperatures Several elements contribute to elevated temperatures within hard drives, including:
Intensive workload operations with high read/write cycles. Insufficient cooling mechanisms inside the computer chassis. Accumulation of dust and debris obstructing airflow. Malfunctioning or inadequate ventilation systems. High ambient temperatures in the surrounding environment. Placement of drives in confined spaces near other heat-generating hardware components. Effective Temperature Management Strategies for Hard Drives Ensuring that hard drives remain within the recommended temperature range requires the implementation of several strategies, such as:
Environmental Control: Maintaining consistent ambient temperatures through efficient air conditioning and climate control systems. Airflow Optimization: Ensuring proper airflow around storage devices to facilitate heat dissipation and prevent localized hotspots. Proactive Monitoring: Utilizing internal and external temperature sensors to identify and rectify airflow deficiencies. Hardware Placement: Strategically positioning storage devices away from components that generate excessive heat. Efficient heat dissipation is crucial to maintaining server reliability. Without proper temperature management, overheating can lead to hardware malfunctions, performance degradation, and even catastrophic system failures.
Temperature Considerations for Solid State Drives (SSDs) While SSDs lack mechanical components, making them less prone to mechanical failure compared to HDDs, they are still highly susceptible to temperature fluctuations. Due to their compact form factor and high-speed data processing capabilities, SSDs typically operate at higher temperatures than HDDs, often exceeding them by approximately 10°C.
Manufacturers generally specify the operational temperature range for SSDs as 0°C to 70°C (32°F to 158°F). However, high-performance SSD variants, such as M.2 SSDs and PCI-E SSDs, demand special attention due to their exposed memory chips and controllers operating at high bandwidths. Heat sinks and proper chassis ventilation play a crucial role in mitigating excessive thermal buildup in these SSD types.
Factors Contributing to High SSD Temperatures Several factors can elevate SSD temperatures, including:
Intensive read/write operations and prolonged workloads. Poor thermal dissipation within the system enclosure. Accumulated dust that obstructs airflow. High ambient temperatures affecting the entire system. Firmware and controller inefficiencies that hinder proper thermal management. Routine firmware updates are critical to addressing temperature-related issues and optimizing overall SSD performance.
Best Practices for SSD Temperature Management Maintaining optimal operating conditions for SSDs involves several best practices, including:
Regulated Ambient Temperature: Ensuring the surrounding environment remains within the recommended range to prevent SSD overheating. Proper Airflow: Deploying efficient cooling solutions and chassis designs that promote adequate airflow. Continuous Monitoring: Using real-time environmental monitoring tools to detect temperature anomalies and implement timely corrective actions.
Long-Term Storage Considerations for SSDs Long-term storage of SSDs requires careful management of temperature differentials between operational and dormant states. During extended periods of power-off, SSDs rely on maintaining the electrical charge within their flash memory cells for data retention. Temperature extremes can accelerate charge degradation, potentially leading to data loss.
For optimal long-term storage conditions, SSDs should be kept at temperatures below 40°C (104°F) to preserve data integrity over time.
Understanding SSD Endurance and Data Retention SSD endurance is a critical factor in determining how much data can be written to the drive before its reliability diminishes. Manufacturers evaluate endurance based on:
Sustained performance under heavy workloads. Error correction and data integrity at elevated temperatures. Data retention capabilities post-write endurance exhaustion. Newer SSD models exhibit improved longevity and can retain data for extended periods at room temperature, even after extensive usage.
Effective temperature management is a cornerstone of data center operations, directly influencing the reliability and longevity of storage devices such as HDDs and SSDs. Proactive environmental monitoring, coupled with strategic airflow and cooling solutions, enables data centers to strike a balance between operational efficiency and hardware longevity.
By investing in robust temperature monitoring solutions, data center operators can minimize downtime, reduce energy consumption, and achieve optimal performance across their IT infrastructure.
DATA CENTER EARLY WARNING SYSTEM (DCEWS) addresses these challenges by integrating Artificial Intelligence (AI) for:
- Automated system monitoring.
- Proactive issue resolution.
- Intelligent decision-making to reduce costs and improve reliability.
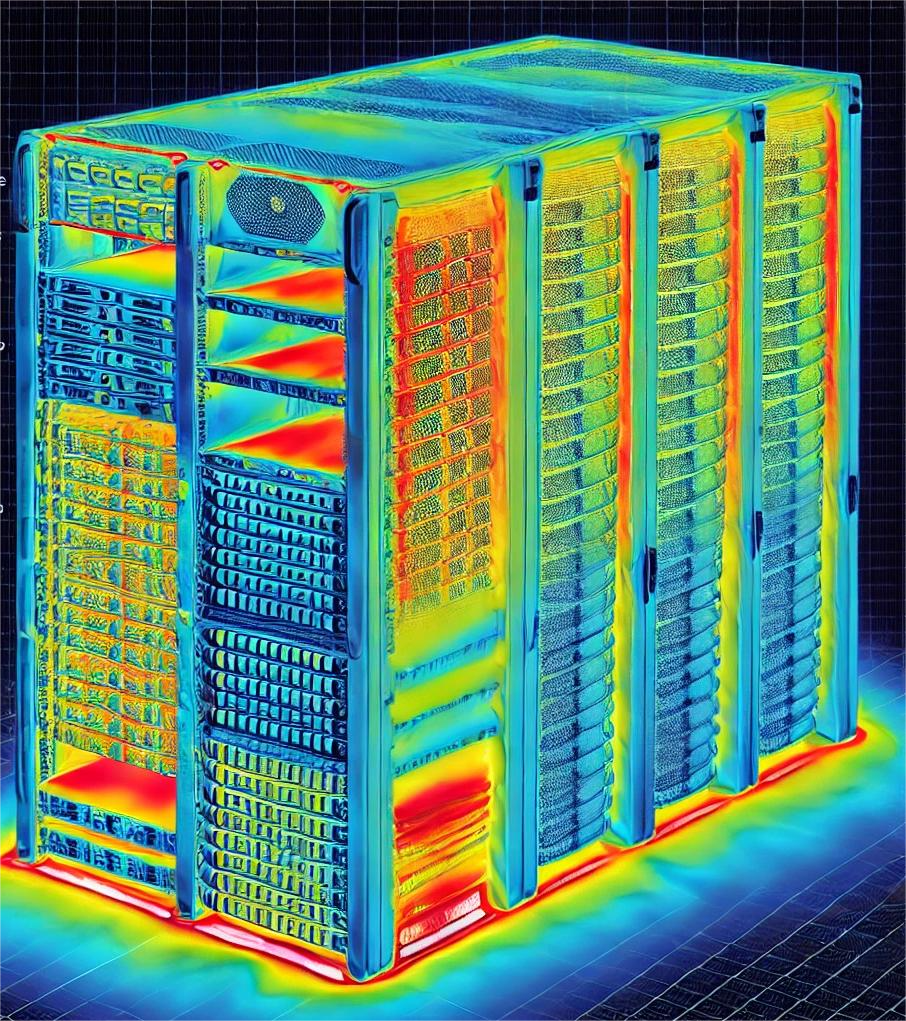
Efficient thermal management is a cornerstone of modern infrastructure operations, particularly in data centers, server rooms, and other high-performance environments. The introduction of advanced thermal map sensors revolutionizes this domain by offering precise, real-time monitoring and analysis of temperature variations. These sensors ensure operational stability, reduce energy consumption, and proactively address risks associated with overheating. This document provides a comprehensive guide on the applications, benefits, features, and operational details of thermal map sensors.
This solution ensures that IT infrastructure operates seamlessly, scaling dynamically to meet organizational needs.
The Problem
Addressing Data Center Pain Points
Efficient cooling and maintaining consistent thermal conditions are critical concerns for data centers. Below are some of the key challenges faced by operators and potential areas for improvement:
1. Cooling Efficiency Challenges
- Continuous Operation Needs: Cooling systems are expected to operate continuously at consistent rates, leading to challenges in optimizing efficiency without disrupting operations.
- Financial Implications of Overcooling: Failure to align cooling with actual thermal needs results in significant financial waste, especially when the air intake temperature falls below the recommended threshold of 64°F.
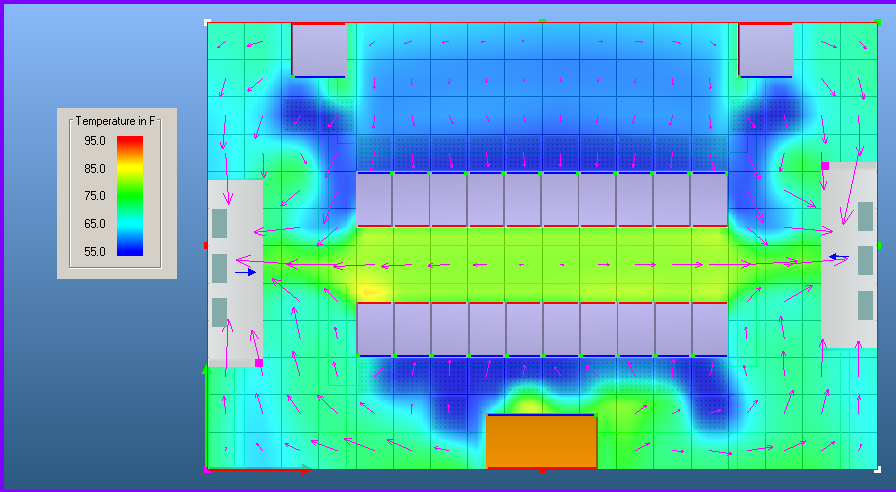
2. Lack of Airflow Insights
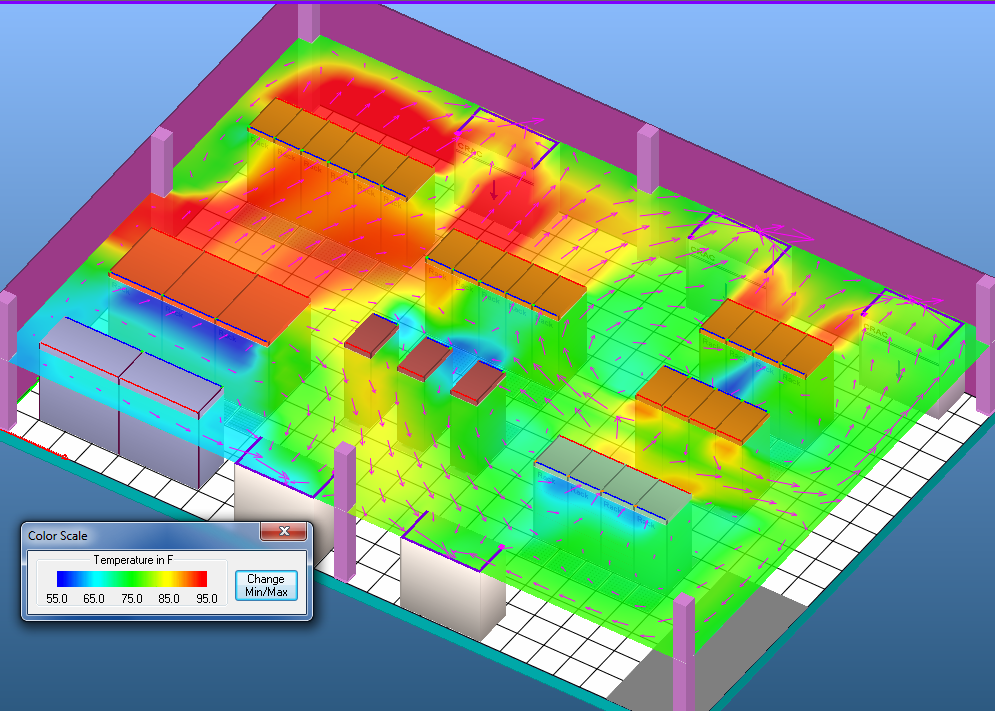
- Airflow Analysis Deficiencies: Gaining insights into airflow patterns and identifying the origin of hotspots remains a pressing issue. This includes challenges associated with:
- Cold-aisle containment
- Hot-aisle containment
- Overhead supply systems
- Underfloor supply systems
- Rack-centered cooling solutions
- Hotspot Identification: Without detailed airflow analysis, operators struggle to discover the root cause of hotspots, leading to inefficient cooling.
3. Need for Wireless-Based Sensors
- Cost-Effective Solutions: Pulling a single Ethernet cable can cost anywhere between $150 to $1,000 per drop, considering cabling, termination, switches, and labor. Wireless sensor deployments offer a more economical alternative, potentially cutting costs by up to 50%.
- Scalability and Flexibility: Wireless sensors provide an adaptable solution for monitoring and managing cooling systems without the extensive infrastructure demands of wired systems.
4. Lack of Unified Visibility
- Single Pane of Glass: There is a need for a centralized platform that provides intuitive insights into cooling non-uniformity.
- Hotspot Patterns: Current systems lack the ability to highlight problematic zones such as the lower and center racks in each row, where temperatures can vary significantly, ranging from 60°F to 90°F.
Absence of Innovative Technologies
- Proactive Cooling Strategies: The lack of machine learning (ML)-governed strategies, such as heat transfer analysis, limits the ability to cool data centers effectively, especially those housing next-generation high-performance processors.
- In-Rack Heat Extraction: One of the toughest challenges for data center operators is efficiently extracting heat from densely loaded racks. To compensate, operators often burn excess power and overcool the floor, which can lead to higher operational costs and inefficiencies.
- By addressing these pain points, data centers can significantly improve cooling efficiency, reduce costs, and create a more sustainable and effective thermal management environment. Incorporating wireless sensors, unified monitoring platforms, and ML-driven cooling strategies will be instrumental in overcoming these challenges.
- As data centers expand, managing space, power, and cooling becomes more challenging. Enterprises are increasingly focusing on system utilization, often finding that around 20% of ghost servers consume energy without serving any business purpose, leading to inefficiencies.
- The Hot air re-circulation in data centers leads to hot spots, equipment overheating, and warning alarms, often prompting reactive solutions that overlook energy efficiency. Lowering intake air temperature below the threshold is typically considered sufficient, but it results in excessive cooling costs. Producing 60°F chilled air is significantly more expensive than optimizing airflow to maintain intake temperatures below 80.6°F using 77°F air, highlighting the need for improved cooling strategies to reduce energy consumption.
What is Broken in Current Data Center Management?
The existing Data Center Infrastructure Management (DCIM) and Data Center Management (DCM) tools and platforms fall short in several critical areas, limiting their effectiveness in addressing modern data center challenges. Below are the key shortcomings:
1. Lack of Actionable and Predictive Insights
Operational Blind Spots: Current tools fail to provide actionable, predictive, or prescriptive insights from an operational standpoint, leaving data center operators to rely on reactive measures rather than proactive strategies. Missed Opportunities for Optimization: Without predictive analytics, operators cannot anticipate potential issues, optimize resource usage, or implement preventive measures to avoid downtime or inefficiencies.
2. Absence of a Distributed, Heterogeneous Sensor Network
Sensor Connectivity Limitations: Modern data centers demand a robust platform capable of connecting a distributed and heterogeneous network of sensors. Current tools often lack this capability, resulting in fragmented data collection and analysis. Integration Challenges: The inability to seamlessly integrate sensors from different vendors creates silos, hindering the ability to obtain a unified view of data center operations.
3. Lack of Full-Stack Visibility
Limited Monitoring Scope: Existing DCIM and DCM tools provide minimal visibility across the full stack of infrastructure, from physical hardware to applications. This restricts IT managers from gaining comprehensive insights into performance and operational health. Manual Efforts and Low Automation: With little to no automation, IT managers must manually gather data from a limited set of standard metrics across multiple tools. This labor-intensive approach not only increases workload but also delays decision-making.
4. Dependency on Fragmented Tools
- Multiple Tool Dependencies: Operators often rely on a patchwork of tools to monitor and manage various aspects of the data center. This fragmented ecosystem makes it challenging to aggregate data and derive meaningful insights.
- Inconsistent Data Interpretation: Different tools use varied metrics and reporting formats, making it difficult to interpret data consistently and act on it effectively. The Path Forward
- To address these shortcomings, next-generation DCIM and DCM platforms must:
- Leverage AI and ML for actionable, predictive, and prescriptive insights.
- Adopt a unified sensor-connect platform that supports distributed and heterogeneous sensors.
- Provide full-stack visibility with automated data collection and centralized monitoring.
- Reduce tool fragmentation by integrating functionalities into a cohesive, single-pane-of-glass solution.
- By bridging these gaps, future data center management platforms can empower operators to make informed decisions, enhance efficiency, and optimize operations proactively.
The Research
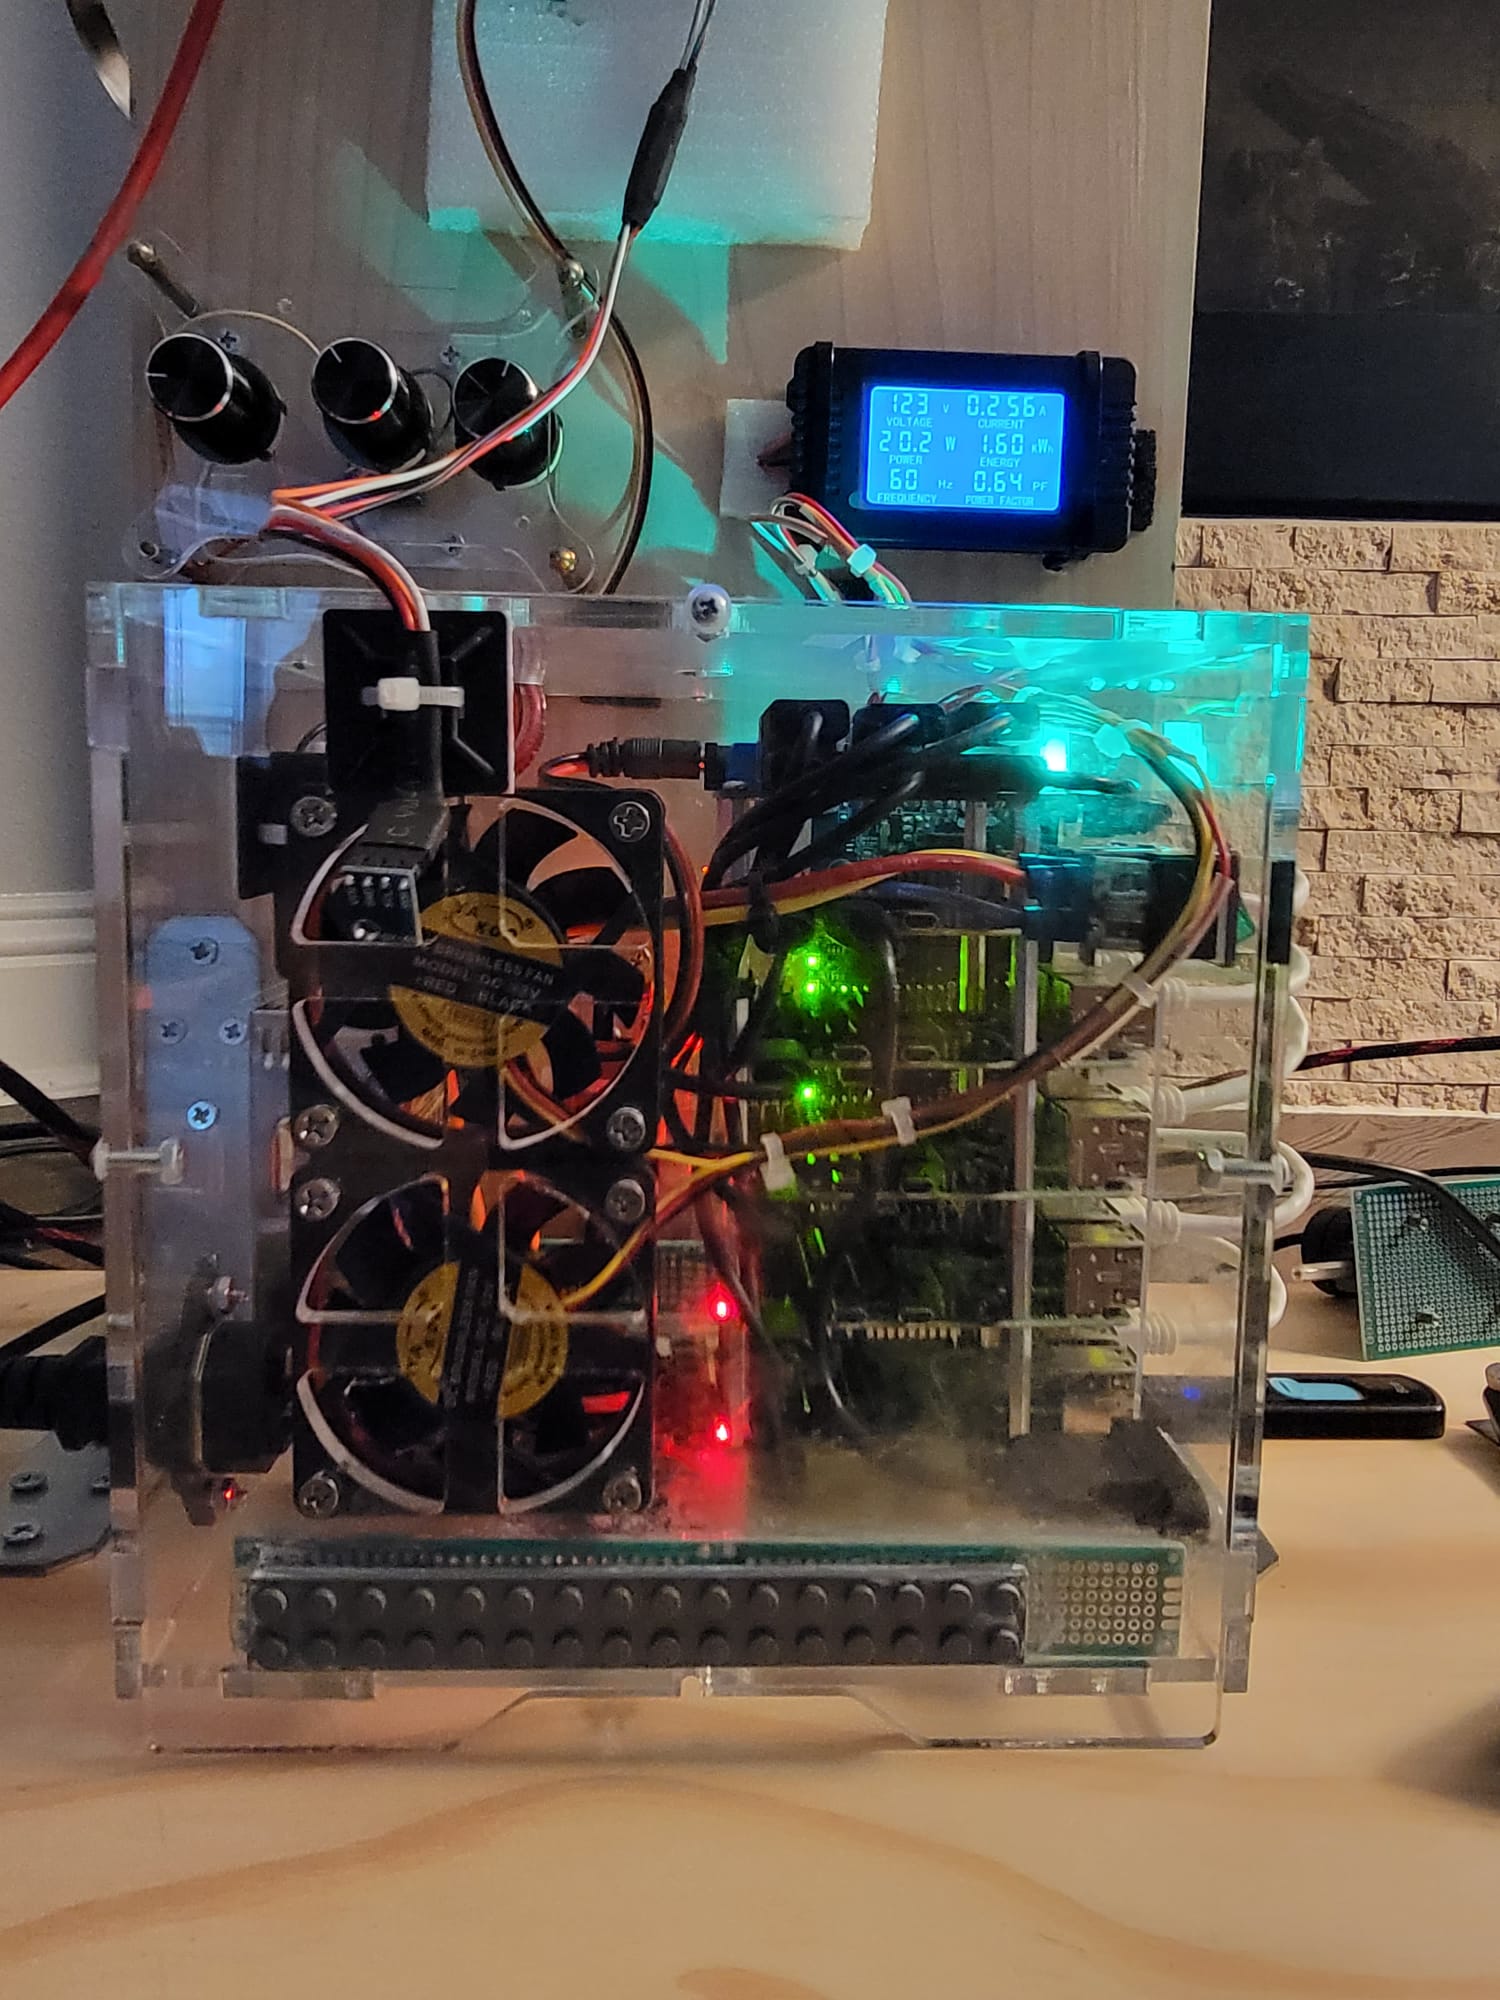
The MVP TestBed
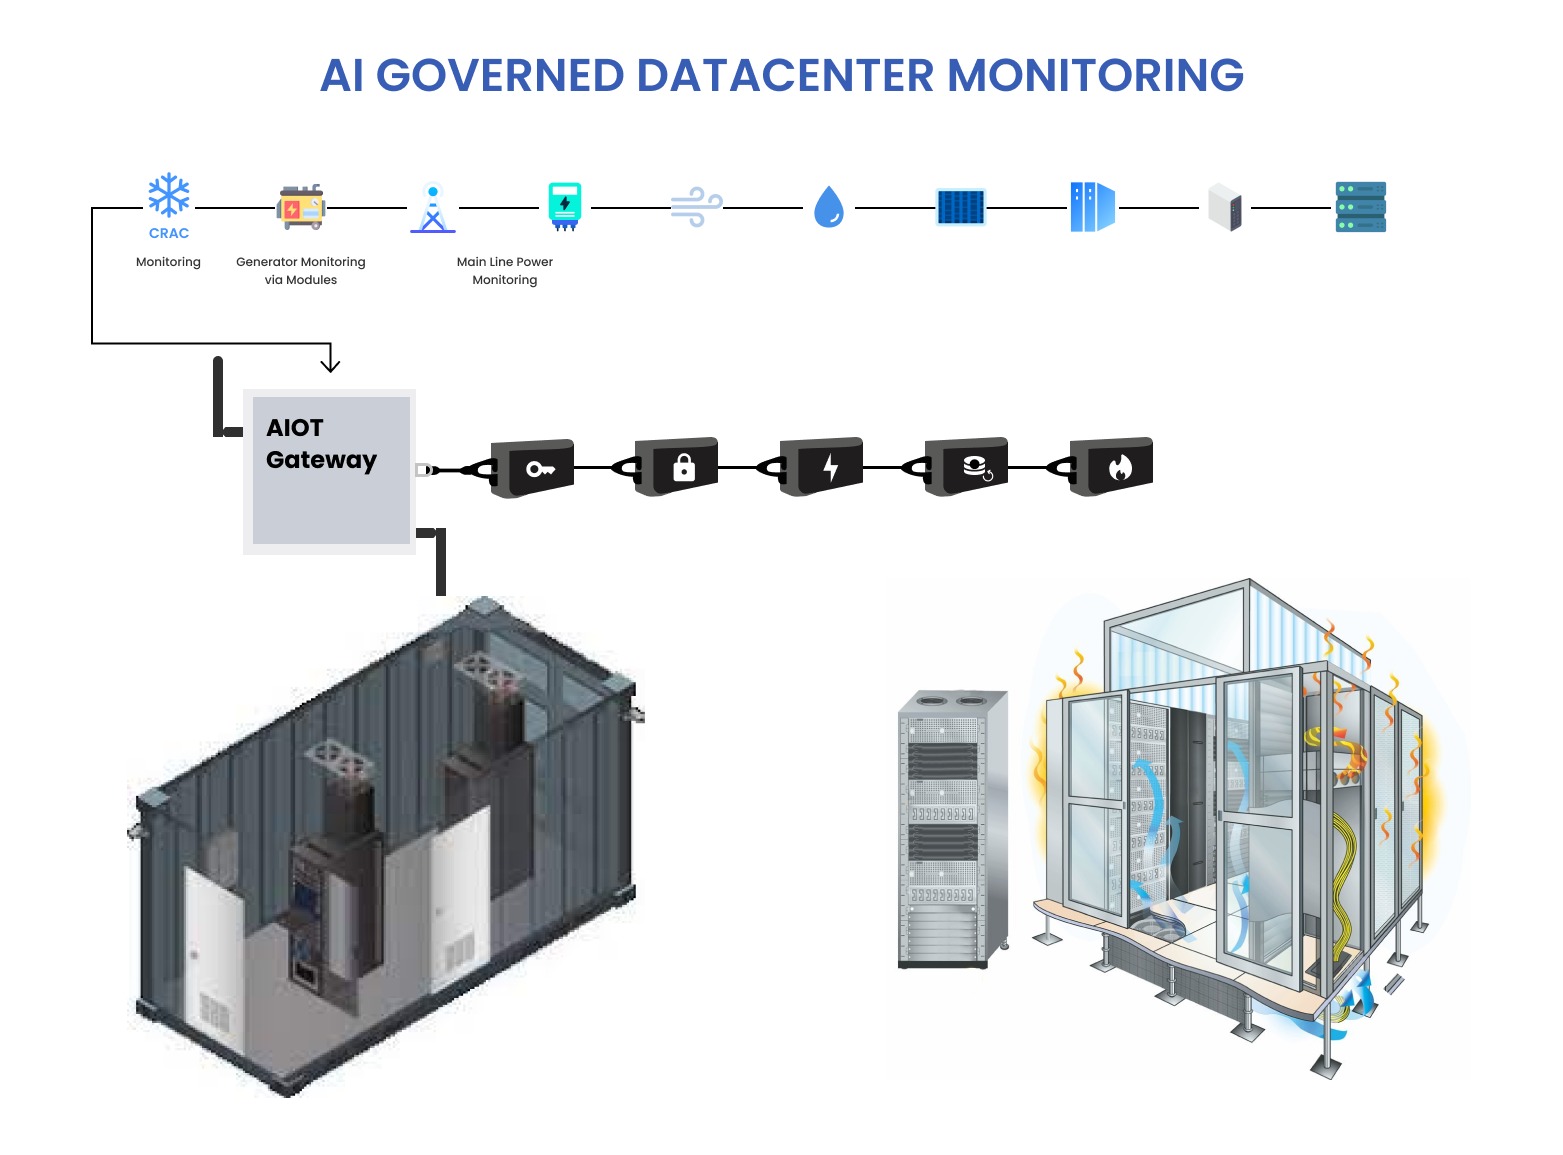
 The DCEWS ecosystem consists of:
- Monitoring Module: Collects real-time data from servers and network devices.
- AI Engine: Processes data for predictive analytics, anomaly detection, and optimization.
- Control Interface: Provides a user-friendly dashboard for insights and management.
Here is an example architecture diagram:
The Solution
🏗️ System Architecture
Thermal Management with Thermal Map Sensors
Types of Thermal Map Sensors
Thermal map sensors are available in various configurations, each tailored to specific needs:
- Rack-Level Sensors Monitor temperatures at multiple levels within each rack. Provide precise readings at the front, rear, top, middle, and bottom for comprehensive coverage.
- Room-Level Sensors Measure environmental conditions across large spaces. Useful for identifying overall temperature gradients and optimizing air circulation.
- Specialized Sensors Designed for high-density server environments or industrial setups. May include features like humidity sensors and multi-zone temperature monitoring.
- Wireless Sensors Flexible installation without cabling constraints. Ideal for retrofitting or temporary deployments in dynamic environments. Applications Thermal map sensors are versatile tools with wide-ranging applications:
Data Centers
Detect hotspots and optimize cooling strategies. Prevent overheating and equipment failure in high-density environments.
Server Rooms
Maintain consistent airflow and temperature distribution. Reduce overcooling, ensuring energy efficiency and cost-effectiveness.
Industrial Facilities
Monitor machinery and operational zones to comply with safety standards. Prevent thermal shutdowns in equipment-intensive environments.
Telecommunication Hubs
Ensure optimal conditions for network and communication equipment. Minimize risks of downtime due to overheating.
Research Laboratories
Provide precise environmental control for sensitive experiments. Ensure compliance with thermal requirements for equipment and processes.
Key Features
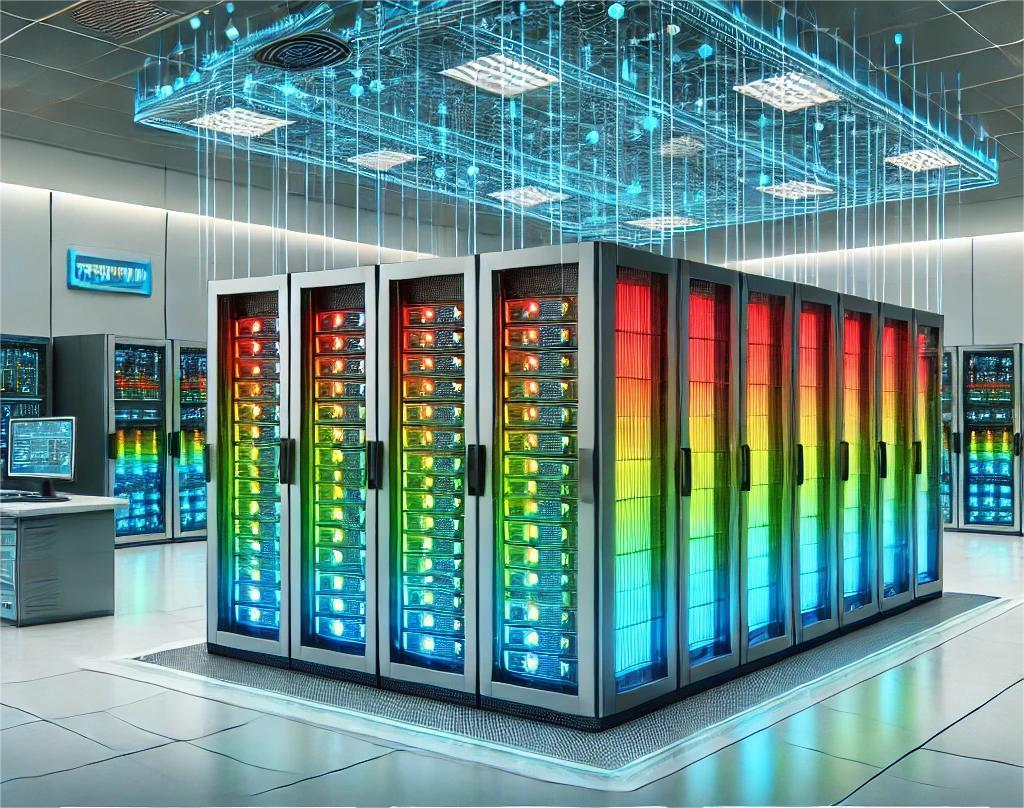
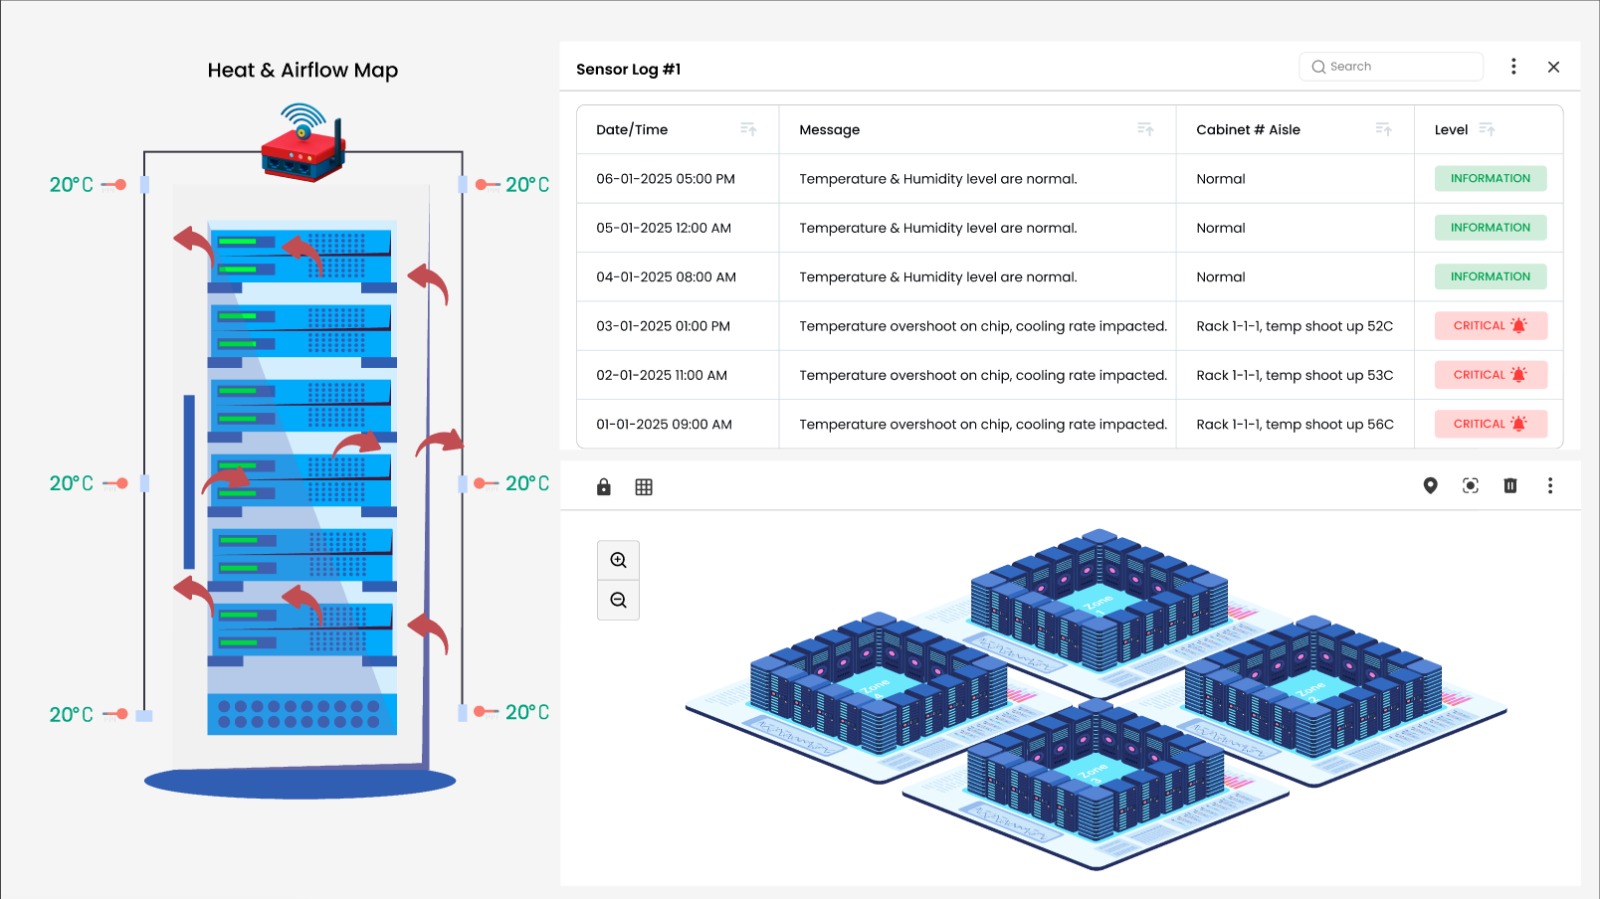
- Real-Time Heatmaps Generate dynamic 2D visualizations of temperature distribution. Continuously update with sensor data to highlight potential issues.
- Multi-Zone Monitoring Monitor individual racks, rooms, or specific zones. Provide granular insights for precise thermal management.
- Alert Mechanisms Visual and audible alarms to notify operators of anomalies. Notifications via email, SMS, and SNMP traps for proactive responses.
- Seamless Integration Compatible with SNMP-based platforms like NMS, BMS, and DCIM software. Easy integration with existing monitoring systems.
- 24/7/365 Operation Continuous monitoring ensures no thermal risk goes unnoticed. Enables predictive maintenance and ongoing optimization.

Advantages
Thermal map sensors provide numerous benefits that make them a vital tool for thermal management:
- Enhanced Precision Accurate temperature readings across multiple points ensure comprehensive monitoring.
- Proactive Risk Management Identify and mitigate hotspots before they cause downtime. Enable predictive maintenance by analyzing patterns over time.
- Energy Efficiency Reduce overcooling and optimize airflow, lowering operational expenses. Support sustainability efforts by cutting energy consumption and carbon footprints.
- Compliance Assurance Meet ASHRAE and Uptime Institute standards for temperature control. Avoid costly disruptions caused by regulatory non-compliance.
- Operational Resilience Minimize the risk of equipment failure due to thermal stress. Ensure continuous uptime for critical infrastructure.

Setup and Installation
Setting up thermal map sensors involves several straightforward steps:
- Planning and Placement Assess the environment to determine optimal sensor placement. Position sensors at critical points within racks and across the room.
- Integration with Systems Connect sensors to monitoring platforms via wired or wireless networks. Configure SNMP compatibility for seamless communication with existing software.
- Calibration and Testing Calibrate sensors for precise measurements. Perform tests to ensure data accuracy and system responsiveness. Maintenance and Support
- Routine Checks Regularly inspect sensors for physical damage or misalignment. Ensure firmware and software are up-to-date for optimal functionality.
- Calibration Recalibrate sensors periodically to maintain accuracy. Address any discrepancies in readings promptly.
- Troubleshooting Use diagnostic tools to resolve connectivity or data issues. Engage support services for complex troubleshooting. Best Practices To maximize the effectiveness of thermal map sensors, follow these best practices:
Adopt Proactive Monitoring
- Regularly review heatmaps and alerts to address issues early. Analyze Data Trends
- Use historical data to identify patterns and optimize cooling strategies. Integrate with Existing Systems
- Leverage compatibility features to streamline operations. Ensure Compliance
- Align monitoring practices with industry standards and guidelines. Use Cases Data Center Optimization
- Identify cost-saving opportunities through efficient cooling adjustments. High-Density Computing
- Maintain thermal balance in environments with intensive computational loads. Disaster Prevention
- Detect early signs of overheating and prevent catastrophic failures.
Future Enhancements
Thermal map sensors continue to evolve, with potential advancements including:
AI-Powered Analytics: Use machine learning to predict and prevent thermal anomalies. Cloud Integration: Enable remote monitoring and control through cloud-based platforms. Multi-Sensor Fusion: Combine temperature data with humidity, airflow, and vibration sensors for comprehensive environmental monitoring.
✨ Key Features
Predictive Maintenance
- Failure Prediction: AI-powered analytics predict equipment failures before they occur, minimizing downtime and ensuring business continuity.
- Health Monitoring: Real-time health monitoring of servers, storage devices, and network gear to identify anomalies and performance degradation.
- Early Issue Detection: AI algorithms detect subtle signs of wear and potential failures often missed by human operators.
Intelligent Inventory Management
- Smart Tracking: Automates tracking of inventory levels, including hardware and software assets.
- Usage Insights: AI provides insights into equipment usage patterns, enabling better forecasting and efficient resource allocation.
- Lifecycle Management: Optimizes equipment lifecycle by identifying when assets need upgrades, repairs, or replacement.
System Configuration and Optimization
- Automated Configuration Checks: Ensures systems remain properly configured, reducing vulnerabilities and operational inefficiencies.
- Dynamic Adjustments: AI dynamically optimizes configurations based on workload demands and usage patterns.
- Policy Enforcement: Enforces compliance with organizational policies and standards.
Proactive IT Support
- Automated Issue Resolution: AI automates routine maintenance and troubleshooting tasks, freeing up human resources for more complex problems.
- Incident Prediction and Prevention: Identifies potential incidents before they escalate, improving system reliability.
- Performance Tuning: Continuously analyzes system performance and suggests actionable improvements.
🛠️ Technology Stack
Project Benefits
- Reliability: Ensures operational uptime.
- Cost Efficiency: Reduces unnecessary expenses.
- Scalability: Grows with dynamic infrastructure needs.
- Sustainability: Manages energy and reduces waste effectively.
The Takeaway
🔍 Why Choose DCEWS?
Proven Expertise: Trusted by industry leaders for robust IT management solutions. End-to-End Support: From setup and deployment to ongoing monitoring and optimization, we’ve got you covered. Innovation at the Core: Leverage the latest in AI, machine learning, and IoT for unparalleled performance and reliability. Reimagine the way you manage IT. Proactively address challenges, optimize performance, and ensure the security of your Local Edge, Distributed IT, and Data Center environments. With us, your IT operations are always one step ahead.
| Feature | DCEWS | Traditional Systems |
|---|---|---|
| Failure Prediction | Yes, AI-powered analytics | Limited, reactive support |
| Resource Optimization | Automated via AI | Manual configurations |
| Real-Time Monitoring | Comprehensive dashboard | Basic logs |
| Scalability | Dynamic and adaptive | Fixed infrastructure |
AI governed | Autonomous handling “AI controlled environment monitoring and handling
Sensor-Governed Solution: Data Center Providers’ Requirements
As data centers continue to expand and evolve, providers are seeking advanced sensor-governed solutions to enhance operational efficiency, improve thermal management, and deliver premium insights to high-profile clients such as Amazon, Google, Microsoft, and Salesforce. Below are the specific requirements and challenges:

Data centers often experience both bypass and re-circulation airflow issues, sometimes occurring independently in different areas and sometimes overlapping. Lowering temperature set points and increasing airflow to address hot spots can unintentionally lead to cooler return air in certain areas, causing fans to circulate uncooled air. This process, known as bypass airflow, can contribute to inefficiencies and even create new hot spots, undermining cooling efforts.
In data centers, managing airflow is complex, with bypass and re-circulation occurring simultaneously. Reactive measures like lowering temperature set points and increasing airflow may result in unintended inefficiencies, such as cooler return air recirculating without cooling, which can lead to energy waste and potential new hot spots. Proper airflow management strategies are essential to avoid such issues and optimize cooling performance. By addressing bypass airflow and hot air re-circulation issues through measures like sealing leaks and adjusting airflow to match demand, data centers can achieve lower Power Usage Effectiveness (PUE) without relying on free cooling.
Effective environmental monitoring in data centers is crucial for equipment performance and longevity. Insufficient cooling can cause overheating, while excessive cooling leads to unnecessary costs. Data Center Infrastructure Management (DCIM) tools help optimize conditions by monitoring and measuring key environmental factors.
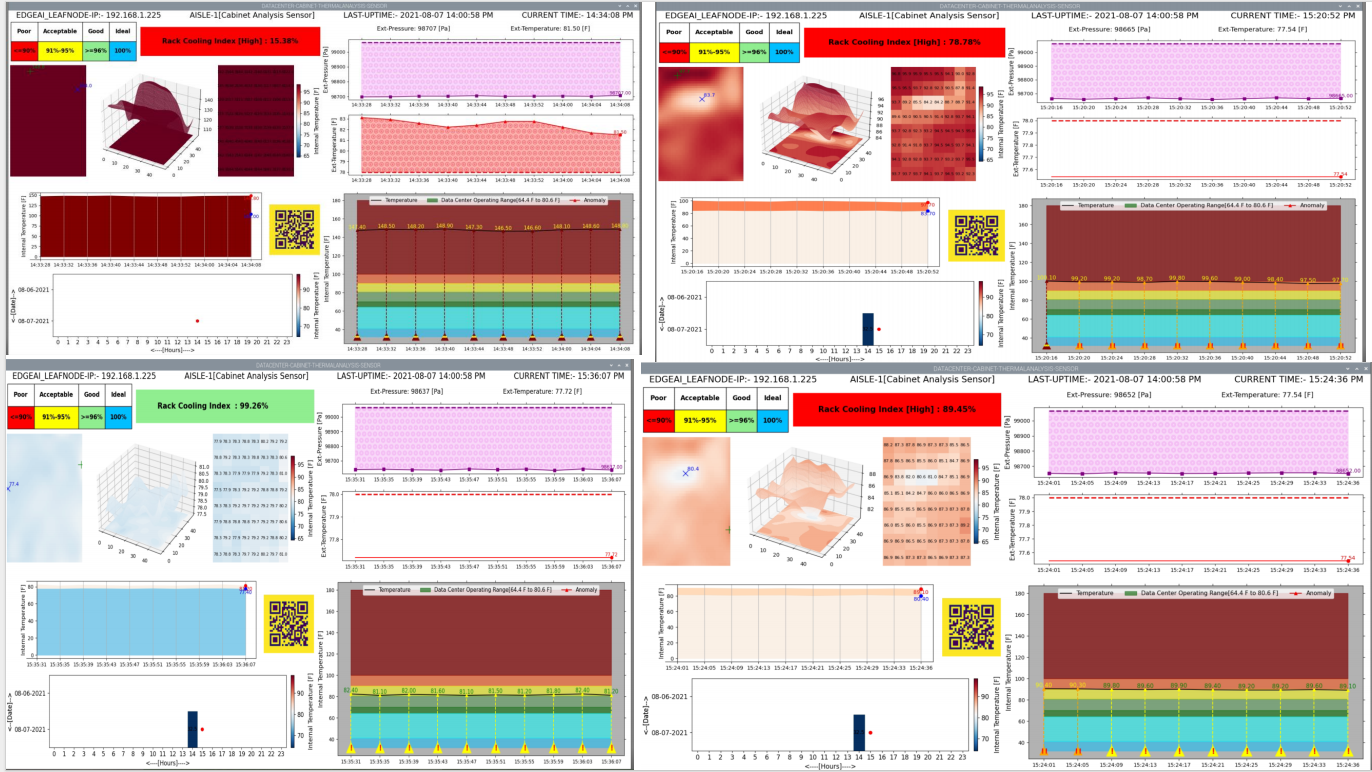
- Cabinet Thermal-Map Analysis
Hotspot Detection: Advanced sensors are needed to perform comprehensive thermal mapping to identify hotspots, monitor intake and exhaust air temperatures, and provide actionable insights for effective cooling management.
Client-Specific Insights: Insights from thermal mapping should be made accessible to premium clients, enabling them to monitor their specific server aisles (e.g., Amazon, Google, Microsoft, Salesforce). RESTful API Interface: The solution should deliver aisle-, rack-, and cabinet-level insights through a RESTful Gateway API, enabling seamless integration with existing monitoring systems and workflows. Challenge:
Lack of Real-Time Capabilities: Current DCIM platforms cannot provide real-time thermal heatmap analysis.
Manual Auditing Processes: Technicians must routinely perform FLIR recordings using thermal imaging cameras and manually upload the data for auditing, which is time-consuming and costly. Thermal Imaging Camera Costs: Rental costs range between $45 and $150 per day, adding a significant financial burden for continuous monitoring. 2. Rack Cooling Index (RCI) Metrics and Influencing Factors
Comprehensive Metrics: Detailed insights into Rack Cooling Index (RCI) gauge metrics and the factors influencing cooling efficiency are critical for optimizing airflow and temperature management.
Aisle/Cabinet/Rack-Level Analysis: Sensors should provide an in-depth analysis of differential temperature (ΔT) and pressure (ΔP) across various levels, including: Front, rear, top, middle, and bottom of the server cabinet. Hot and cold aisle containments for a holistic 360-degree view. Environmental Insights: Additional metrics such as humidity values should be included to assess their impact on cooling performance and operational reliability. Challenges:
Inadequate Sensor Deployment: Current systems lack the capability to perform detailed, real-time RCI analysis with environmental parameter tracking.
Manual Efforts: The absence of automated and integrated solutions forces reliance on periodic manual data collection and interpretation, leading to inefficiencies. Proposed Sensor-Governed Solution: To address these pain points, the ideal solution must incorporate:

Real-Time Thermal Mapping: Implement advanced thermal sensors capable of real-time hotspot detection and mapping.
RESTful API Integration: Provide clients with easy access to insights via APIs, ensuring compatibility with modern monitoring systems. Comprehensive Environmental Monitoring: Use multi-level sensors to track differential temperature, pressure, and humidity for a detailed understanding of airflow and cooling performance. Automation and Cost Reduction: Replace manual processes with automated, sensor-driven workflows to reduce costs and improve efficiency. By leveraging cutting-edge sensor technology and integrating with intelligent monitoring systems, data center providers can offer enhanced services to their clients, optimize cooling strategies, and significantly reduce operational overhead.
Thermal Management and Optimization in Data Centers
The Challenge of Overheating in Data Centers
Overheating servers rank as the second leading cause of unplanned data center downtime, accounting for nearly one-third of all outages. This pervasive issue underscores the critical need for effective thermal management. In response, many data centers adopt overcooling strategies, which, while mitigating thermal risks, result in excessive energy consumption, higher operational costs, and increased carbon emissions. A balanced approach is essential to optimize energy efficiency, reduce costs, and enhance overall system reliability.
Real-Time Monitoring with Heatmaps
Dynamic 2D Heatmaps: Real-time heatmaps provide continuous temperature monitoring at the rack level, offering an in-depth view of thermal conditions within the data center. Each rack is equipped with multiple sensors strategically placed at key points (front and rear, top, middle, and bottom). These sensors deliver accurate, real-time data that allows operators to:
Detect hotspots swiftly.
Identify high rack inlet temperatures. Address incorrect air temperature readings promptly. Benefits: This real-time visualization enables proactive interventions, ensuring thermal risks are managed effectively while maintaining optimal operational conditions.
Proactive Hotspot Detection and Alerts
Identifying Hotspots: Accurate thermal mapping and analysis tools enable the identification of hotspots before they escalate into critical problems. Advanced alert mechanisms ensure timely responses through:
Visual and audible alarms.
Notifications via email and SMS. Integration with SNMP traps for seamless operation within existing network management, building management, and data center infrastructure management software. Seamless Integration: The system’s compatibility with SNMP V1/2/3 ensures straightforward integration with widely used monitoring platforms, making it a valuable addition to existing infrastructure.
Continuous Thermal Optimization
Round-the-Clock Monitoring: Effective thermal management demands 24/7/365 monitoring and analysis. By leveraging advanced sensor networks, data center operators can:
- Detect and address potential thermal issues before they compromise critical infrastructure. Adjust to changing data center loads, optimizing energy consumption and uncovering cost-saving opportunities.
- Use thermal data not only for alerts but also for ongoing analysis to refine operational efficiency.
- Industry Compliance and Best Practices
- Ensuring Compliance:
- Proper sensor placement at each rack aligns with the recommendations of the ASHRAE (American Society of Heating, Refrigerating and Air-Conditioning Engineers) and the Uptime Institute, two leading authorities in data center operations. By adhering to these guidelines:
Operators achieve 100% compliance with temperature and placement standards.
The risk of thermal shutdowns, a leading cause of outages, is significantly reduced.
Operational Impact:
Compliance enhances system reliability and aligns operations with industry-recognized best practices, boosting stakeholder confidence and reducing downtime.
The Need for Proactive Thermal Management
Thermal risks pose a significant challenge to data center reliability and efficiency. By adopting advanced thermal management tools and strategies, operators can:**
Proactively identify and address hotspots. Optimize energy consumption and reduce carbon footprints. Prevent unplanned downtime and protect critical infrastructure. Comply with industry standards to enhance operational reliability. Embracing proactive thermal management ensures that data centers remain resilient, energy-efficient, and cost-effective in meeting the demands of modern digital operations.

AI-Powered Equipment and Environmental Management System
This project focuses on integrating AI and advanced sensor technologies to monitor, analyze, and optimize equipment performance and environmental conditions, particularly in data centers and industrial facilities. The system leverages continuous monitoring, predictive analytics, and real-time adjustments to ensure operational efficiency, reduce downtime, and extend equipment lifespan.
Core Features and Capabilities
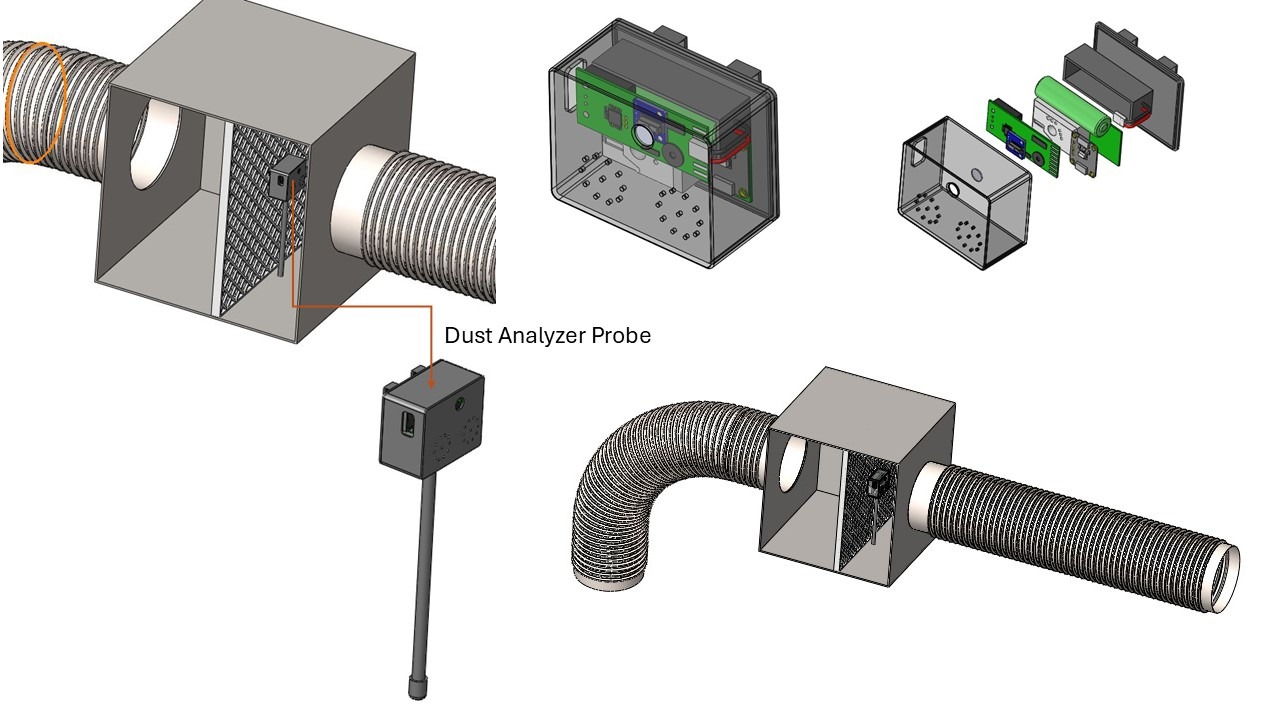
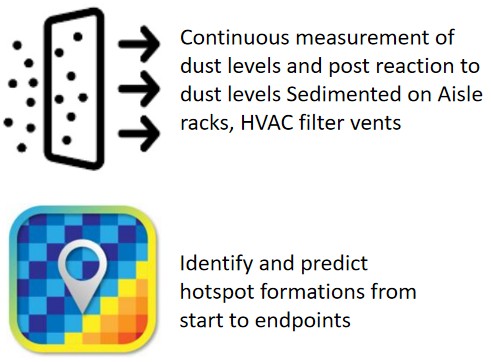
1. Dust and Air Quality Monitoring
- Continuous Dust Measurement:
- Tracks dust levels in critical areas, including aisle racks and HVAC filter vents, ensuring timely detection of sedimentation.
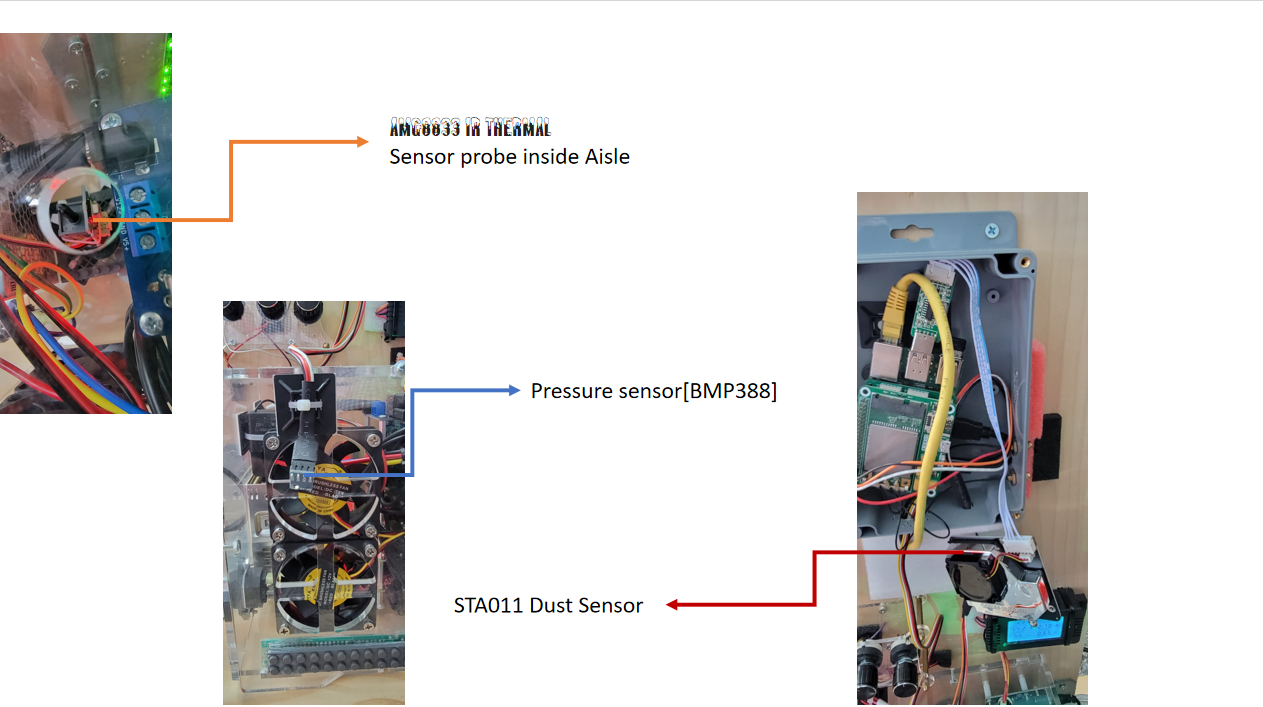
- Uses STA011 dust sensors to evaluate dust thickness and impact on airflow and cooling efficiency.
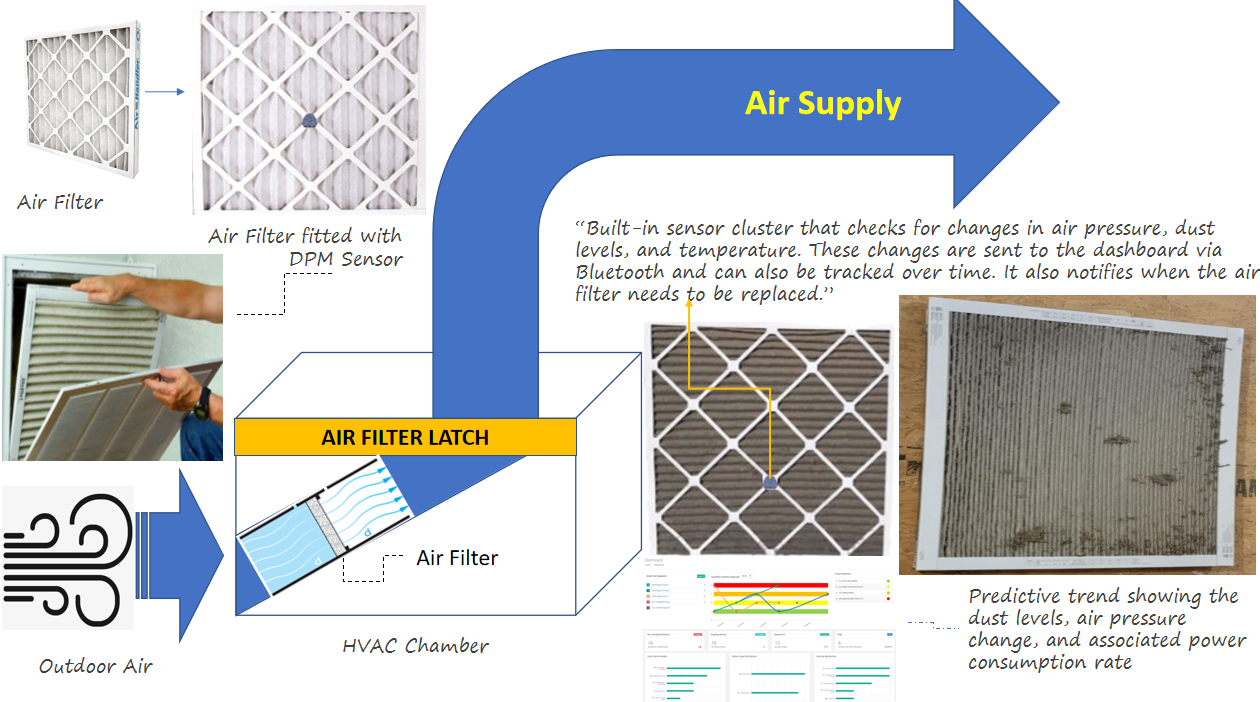
- Air Filter Monitoring:
- Built-in sensor cluster detects air pressure, dust levels, and temperature changes in real-time.
- Provides predictive trends showing the relationship between dust levels, air pressure, and power consumption.
- Notifies when air filters need replacement, ensuring optimal performance.
2. Predictive Hotspot Detection
- Hotspot Identification:
- Predicts and identifies hotspot formations from start to endpoints in densely loaded server racks.
- Employs AMG8833 IR thermal sensors to monitor heat distribution.
- Heat Extraction Analysis: Evaluates the toughest challenges faced by data center operators in heat extraction, minimizing the need for excessive cooling and power consumption.
3. Cooling Efficiency Management
- Enhanced Cooling Monitoring:
- Tracks cooling efficiency and ensures it operates continuously at optimal rates.
- Uses BMP388 pressure sensors to monitor changes in airflow velocity caused by varying dust levels.
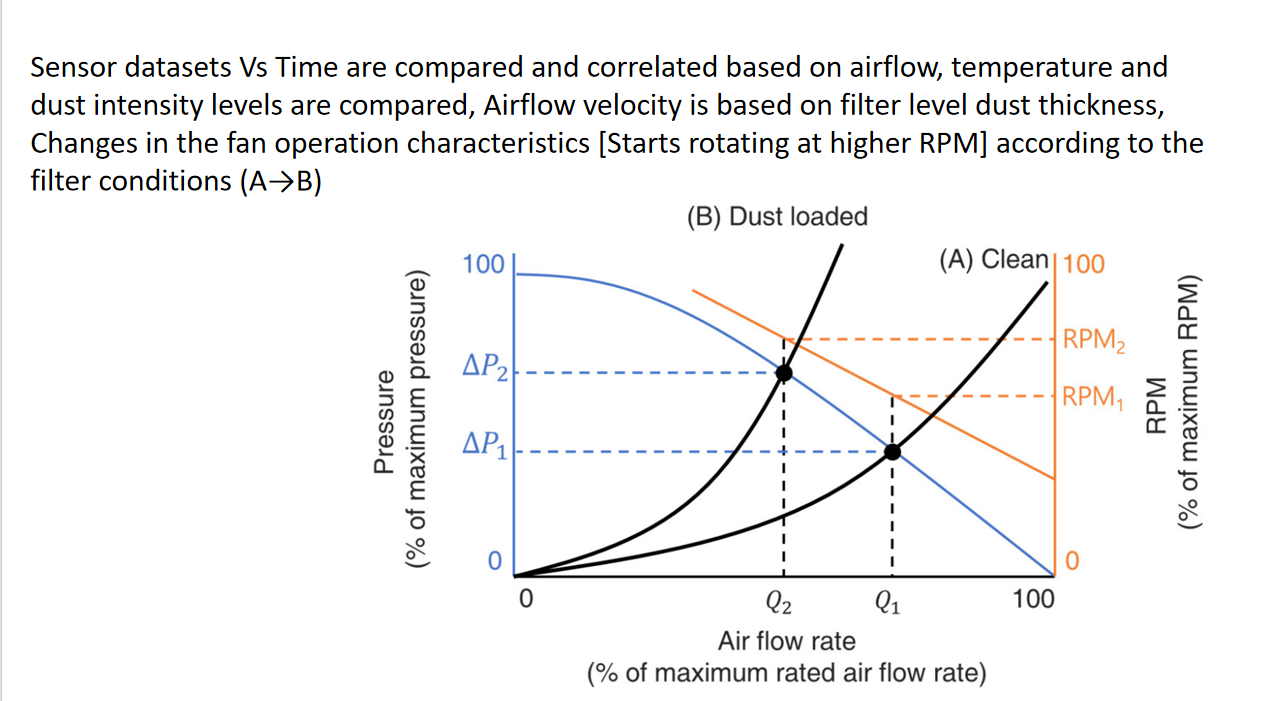
- Dynamic Fan Adjustments: Monitors changes in fan RPM based on filter conditions, dynamically adapting to maintain efficient airflow.
4. AI-Powered Predictive Maintenance
- Filter Dust-Loading Estimation:
- Measures pressure drop (ΔP) before and after air filters to evaluate dust-loading effects on airflow and cooling performance.
- Uses continuous variables such as ΔP(filter) and RPM to predict operational impact. Correlated Sensor Data:
- Compares sensor datasets over time, correlating airflow, temperature, and dust levels to provide actionable insights.
- Predicts power consumption changes and performance degradation trends.
- Sensor Architecture and Integration
- Air Filter Latch with Sensor Cluster:
- Integrated dust, pressure, and thermal sensors.
- Provides Bluetooth-enabled dashboards for real-time tracking and historical data analysis. Predictive Insights Dashboard:
- Displays time-based comparisons of sensor data, offering a clear view of environmental and equipment conditions.
- Highlights operational anomalies and suggests maintenance actions.
- Heat extraction is the toughest challenge faced by data center operators to compensate it burns more power and makes the floor cooler than normal and get rid of hot-spots generation in densely loaded RACKS
- Cooling efficiency is top of mind and is expected tp run continuously at the same rate.
| Filter Condition | CF (%) | ΔPfilter (Pa) | RPM |
|---|---|---|---|
| Clean Filter | 0 | 10 | 1500 |
| 10% Covered | 10 | 12 | 1450 |
| 20% Covered | 20 | 15 | 1400 |
| … | … | … | … |
| 90% Covered | 90 | 40 | 1000 |
Revolutionize IT Management: Proactively Monitor, Optimize, and Safeguard IT Infrastructure Across Local Edge, Distributed IT, and Data Centers
Empower your organization with next-generation IT management solutions tailored to meet the complexities of modern infrastructure. Ensure seamless operations, enhanced security, and superior performance with a suite of advanced features designed for proactive monitoring and management.
Comprehensive IT Oversight with Unified Dashboards
Customizable Dashboards: Simplify IT monitoring with intuitive, template-driven dashboards that can be tailored to individual needs. Visualize critical data points, system health metrics, and performance indicators in real-time. Single-Pane-of-Glass Visibility: Integrate all IT assets under one unified platform for holistic management, eliminating the need for multiple tools and disparate systems.
Remote Device Management & Monitoring
Effortless Remote Access: Manage and monitor devices across geographies from a centralized console, ensuring 24/7 uptime. Automatic Device Discovery: Zero-touch provisioning enables instant setup and onboarding of devices, reducing manual effort. Pre-configured Templates: Expedite deployment with pre-built templates designed to accommodate diverse IT ecosystems.
Proactive Problem Detection and Resolution
Intelligent Alerts: Stay ahead of potential issues with preemptive monitoring that detects abnormal usage patterns, configuration changes, and performance anomalies. Self-Learning Systems: Machine learning-powered baselines continuously adapt to evolving workloads, ensuring accurate detection and minimized false alarms. Root Cause Diagnostics: Automatically correlate and diagnose problems, reducing mean time to resolution (MTTR) from hours to minutes.
Built-in Analytics and Advanced Reporting
Key Performance Indicators (KPIs): Monitor essential metrics that align with organizational goals for IT performance and reliability. In-depth Analytics: Leverage data visualization tools and predictive models to uncover insights, identify trends, and plan for future capacity needs. Automated Reports: Generate actionable reports on device performance, security vulnerabilities, and system health to inform strategic decisions.
Enhanced Security and Vulnerability Management
Device Health Assessments: Continuously evaluate device security postures and identify potential vulnerabilities to preempt breaches. Encrypted Communications: Protect sensitive data with end-to-end encryption, secure payloads, and unique sensor key validations. Activity Monitoring: Track changes and access patterns across your IT environment to ensure compliance and mitigate unauthorized access.
Revolutionary Sensor Technology
Smart Sensor Systems: Deploy indoor RF, lighting, and vibration sensors powered by innovative FIX & FORGET technology for effortless long-term operation. Dynamic Power Management: Optimize battery usage and extend sensor shelf life with intelligent protocols. Reconfigurable Backhaul Networks: Adapt and scale your wireless sensor infrastructure to evolving requirements. Performance Monitoring Over Time: Identify performance hot spots, analyze peak usage hours, and predict potential outages.
Real-Time Data Integration and Visibility
Actionable Insights: Provide IT teams with the tools to diagnose, triage, and resolve issues before they impact end-users. Dynamic Charting and Visualization: Harness interactive charts and graphs to monitor CPU usage, memory, disk activity, and more in real-time. Correlated Data Streams: Synchronize and cross-verify metrics across systems for a unified view of IT performance.
Empower IT Teams with Smarter Tools
Scalable Solutions: From local edge setups to sprawling distributed IT networks and large-scale data centers, adapt seamlessly to varied environments. Machine Learning Integration: Automate anomaly detection, performance tuning, and predictive maintenance with cutting-edge AI algorithms. User-Friendly Interfaces: Reduce complexity with intuitive designs that improve operational efficiency and reduce training requirements.
Key Outcomes for Your IT Infrastructure
Reduced Downtime: Minimize disruptions with faster issue detection and resolution. Improved Operational Efficiency: Streamline IT workflows and automate repetitive tasks. Enhanced Security Posture: Proactively safeguard against vulnerabilities and threats. Future-Ready Infrastructure: Prepare for growth with scalable, intelligent solutions that evolve with your business needs.
Data Center Infrastructure Management (DCIM) solutions offer numerous benefits, they also have several shortcomings and challenges that organizations should consider:
High Implementation Costs:
Initial Investment: Purchasing hardware (servers, storage, networking) can be expensive. Software licenses for DCIM tools can also carry a hefty price tag, especially for enterprise-level solutions. Specialized sensors and monitoring equipment may be required for comprehensive data collection. Ongoing Expenses: Maintaining and upgrading hardware and software involves ongoing costs. Regular maintenance contracts for hardware and software support are often necessary. Ongoing licensing fees for software may apply. Skilled IT personnel are required for installation, configuration, and ongoing management, adding to labor costs.
Complexity of Integration:
Interfacing with Diverse Systems: Integrating DCIM with existing IT systems like cloud platforms (AWS, Azure, GCP), legacy infrastructure, and third-party applications (virtualization, monitoring tools) can be complex. Ensuring seamless data flow and avoiding data silos requires careful planning and integration efforts. Compatibility Challenges: Compatibility issues may arise with older equipment and diverse vendor ecosystems. Ensuring that all components within the data center can be effectively monitored and managed by the DCIM system can be a significant hurdle.
Steep Learning Curve:
Complexity of Tools: DCIM tools can be complex with numerous features and functionalities. Mastering the system requires significant training for IT staff, which can be time-consuming and expensive. User Interface: The user interface and reporting features of some DCIM tools may not be intuitive for non-technical users, hindering their ability to effectively utilize the system. This can lead to user frustration and reduced adoption within the organization.
Data Accuracy Challenges:
Inaccurate Data Input: Manual data entry is prone to errors, leading to inaccurate data within the DCIM system. Inconsistent asset tracking methods can also contribute to data inaccuracies. Impact on Reporting: Inaccurate data can significantly impact the reliability of reports generated by the DCIM system. This can lead to incorrect capacity planning, inefficient resource allocation, and poor decision-making.
Scalability Limitations:
Difficulty Scaling with Growth: Some DCIM solutions may not scale effectively as the data center grows. Adding new devices, expanding capacity, or integrating new sites can become increasingly challenging. Increased Costs with Scaling: Scaling up often requires additional hardware, software licenses, and potentially significant reconfiguration efforts, leading to increased costs.
Lack of Real-time Insights:
Delayed Responses: Many DCIM tools do not provide truly real-time monitoring and alerts, leading to delayed responses to critical issues. This can result in increased downtime and potential service disruptions. Hindrance to Proactive Decision-Making: Latency in data collection and processing can hinder proactive decision-making and prevent timely interventions to prevent problems.
Security and Compliance Risks:
Cybersecurity Threats: DCIM solutions can become a target for cyber threats if not properly secured. Data breaches can expose sensitive information about the data center and its operations. Compliance Requirements: Compliance with data regulations (e.g., GDPR, HIPAA) may require additional configurations, audits, and security measures to be implemented within the DCIM system.
Vendor Lock-in:
Dependence on Single Vendor: Organizations may become dependent on a single vendor’s ecosystem, making it difficult to switch providers or adopt new technologies. Limited Interoperability: Proprietary solutions may have limited interoperability with open-source or competitor products, restricting flexibility and future options.
Limited Predictive Analytics:
Lack of Advanced AI/ML Capabilities: While some DCIM platforms include predictive features, many lack advanced AI/ML capabilities to accurately foresee potential failures. This can limit the ability to proactively address issues and prevent downtime. Customization and Investment: Implementing robust predictive analytics often requires significant customization and investment in specialized AI/ML models.
Performance Overhead:
Resource Consumption: Running DCIM software can consume significant system resources, potentially impacting overall data center performance. This can lead to slower application response times and reduced overall system efficiency. Downtime from Updates: Frequent software updates may introduce downtime or performance degradation, disrupting critical operations.
Rack Cooling Index (RCI)
Rack Cooling Index (RCI) is a metric used to assess the effectiveness of cooling within server racks. It takes into account both temperature and airflow, providing a quantitative measure of how well a rack is cooling the IT equipment it contains. RCI helps data center operators identify potential cooling issues and optimize cooling strategies, ensuring that equipment operates within safe temperature ranges and maintains optimal performance.
Key Benefits
Operational Efficiency:
- Improves system performance by maintaining optimal airflow and temperature conditions.
- Reduces energy consumption by addressing hotspots and improving cooling efficiency.
- Proactive Maintenance:
- Predicts potential failures and recommends preventive actions.
- Extends the lifespan of critical equipment and components.
- Enhanced Reliability:
- Continuous monitoring ensures timely identification of anomalies.
- Minimizes downtime by addressing issues before they escalate.
- Cost Optimization:
- Reduces power consumption by optimizing fan and cooling operations.
- Minimizes maintenance costs through predictive trends and proactive measures.
Sustainability:
- Promotes energy-efficient operations and reduces waste.
- Future Enhancements
- Machine Learning Models:
- Develop algorithms to refine predictions for hotspot formations, filter replacements, and power consumption.
Real-Time Alerts:
- Implement advanced notification systems for immediate corrective actions.
- Integration with IoT Platforms:
- Enable seamless data sharing and integration with broader smart facility management systems.
- This AI-powered equipment and environmental management system is designed to transform infrastructure management by ensuring efficiency, reliability, and sustainability through cutting-edge technology.
🌟 Use Cases
1. Data Center Monitoring:
- Tracks server health, performance, and capacity.
- Sends alerts for anomalies like overheating or resource bottlenecks.
2. IT Operations Automation:
- Predicts hardware failures and schedules maintenance automatically.
- Balances workloads across servers to optimize performance.
3. Edge Computing Optimization:
- Provides heatmaps to detect hotspots and cooling inefficiencies.
- Stores and retrieves 48-hour event history for forensic analysis.
4. Energy Efficiency Management:
- Dynamically adjusts cooling systems based on real-time metrics.
- Reduces power consumption by shutting down underutilized servers.
5. DCEWS Heat spot organization Visualization Features enables to
5.1) Customizable Data Overlays: Allow users to overlay additional metrics such as power consumption, airflow efficiency, and rack density onto the heatmap for a more comprehensive analysis.
5.2)Real-Time Alerts and Threshold Indicators: Incorporate dynamic alerts that highlight critical temperature thresholds, enabling proactive responses to potential issues.
5.3)Predictive Analytics Integration: Use AI-driven insights to forecast potential overheating risks based on historical trends, seasonal variations, and equipment usage patterns.
5.4)Drill-Down Capabilities: Enable users to zoom into specific areas of the facility, down to individual racks or equipment, for granular insights and targeted troubleshooting.
5.5)Customizable Reporting Dashboards: Provide tailored reports that can be exported and shared with stakeholders, summarizing trends and recommendations based on heatmap analysis.
5.6)Multi-Facility Comparison: Allow data center owners to compare heatmaps across multiple locations to benchmark performance and identify optimization opportunities.
5.7)Integration with IoT Sensors: Connect with IoT-enabled sensors to collect real-time data from critical equipment and dynamically update the heatmap for continuous monitoring.
5.8)Historical Trend Analysis: Offer time-lapse heatmaps to analyze temperature trends over days, weeks, or months, helping with capacity planning and energy efficiency improvements.
5.9)User-Friendly Mobile Access: Mobile-friendly version of the heatmap visualization, allowing facility managers to monitor conditions from anywhere. 5.10)Interactive Collaboration Tools:
Provide annotation and collaboration features, enabling teams to mark areas of concern and share insights in real time across departments. By implementing these features, data center operators can maximize operational efficiency, improve cooling strategies, and extend the lifespan of critical equipment.
Project Overview
This section presents recent architectural and functional additions that significantly enhance the system’s robustness, scalability, and real-time intelligence.
Database Design Overview
The platform relies on PostgreSQL, featuring dedicated tables for structured sensor and predictive data:
| Table Name | Description |
|---|---|
| sensor_data | Stores internal/external temperature, Ext.pressure, etc. |
| additional_metrics | RCI scores, thresholds, anomalies, performance metrics |
| thermal_sensor_data | Thermal imaging data with min/max/avg temperature |
| dust_sensor_data | Dust levels, ΔP (pressure drop), and fan RPM |
| predict_rci | Stores model predictions (ARIMA Future trends) |
| inference_results | Stores model predictions (LSTM Anomaly prediction, prophet Future Trends, Pearson matrix) |
| Network_metrics_snapshots | Stores Overall network & system informations |
📈 AI Forecasting Engine
We’ve implemented a robust multi-model forecasting setup using:
- ARIMA – Used for RCI and internal temperature prediction.
- rci_predict.py – Handles real-time inference for upcoming 5-minute intervals.
- LSTM – Anomaly predictions for overall sensor data.
- inference_service_api.py – infer the overall sensor data and provides anomaly status and anomaly confidence percentage.
- LSTM & Prophet – infere overall sensor data health pattern and Predicts future trends for overall sensor data.
- inference_service_api.py – infer the overall sensor data and provides the current health trend patterns also predicts the future trends.
🧱 Modular Microservice Architecture
| Service Name | Script Name |
|---|---|
| Inference API | inference_service_api.py |
| DeepSeek RAG AI Engine | langchain_modules/main_app.py |
| ARIMA Prediction Service | infer_arima.py |
| WebSocket Broadcaster | WAPI/main.py |
| Bulk Data Handler | WAPI/bulk/main.pydeep_handler_keyworddeep_handler.py |
🧠 RAG + Langchain Agent-Driven Intelligence
The platform integrates LangChain and DeepSeek LLM agents to:
- Generate structured health check reports.
- Pull the latest sensor data directly from the PostgreSQL database.
- Output .docx or markdown-based reports with smart interpretations.
⚙️ Deployment & Service Management
Services are managed using:
- systemd service files for each FastAPI or subscriber script.
- Isolated virtual environments for runtime consistency.
- Cron jobs for backups or task scheduling.
📚 API Overview
API endpoints for:
- Sensor data retrieval
- Additional Sensor data metrics
- Thermal image sensor data
- Network metrics data
- Future trend/Anomaly predict/correlation matrix data endpoint
- Langchain LLM / RAG AI prompt inference endpoint
- RCI prediction inference endpoint
- AI-generated health report endpoint
Project Overview
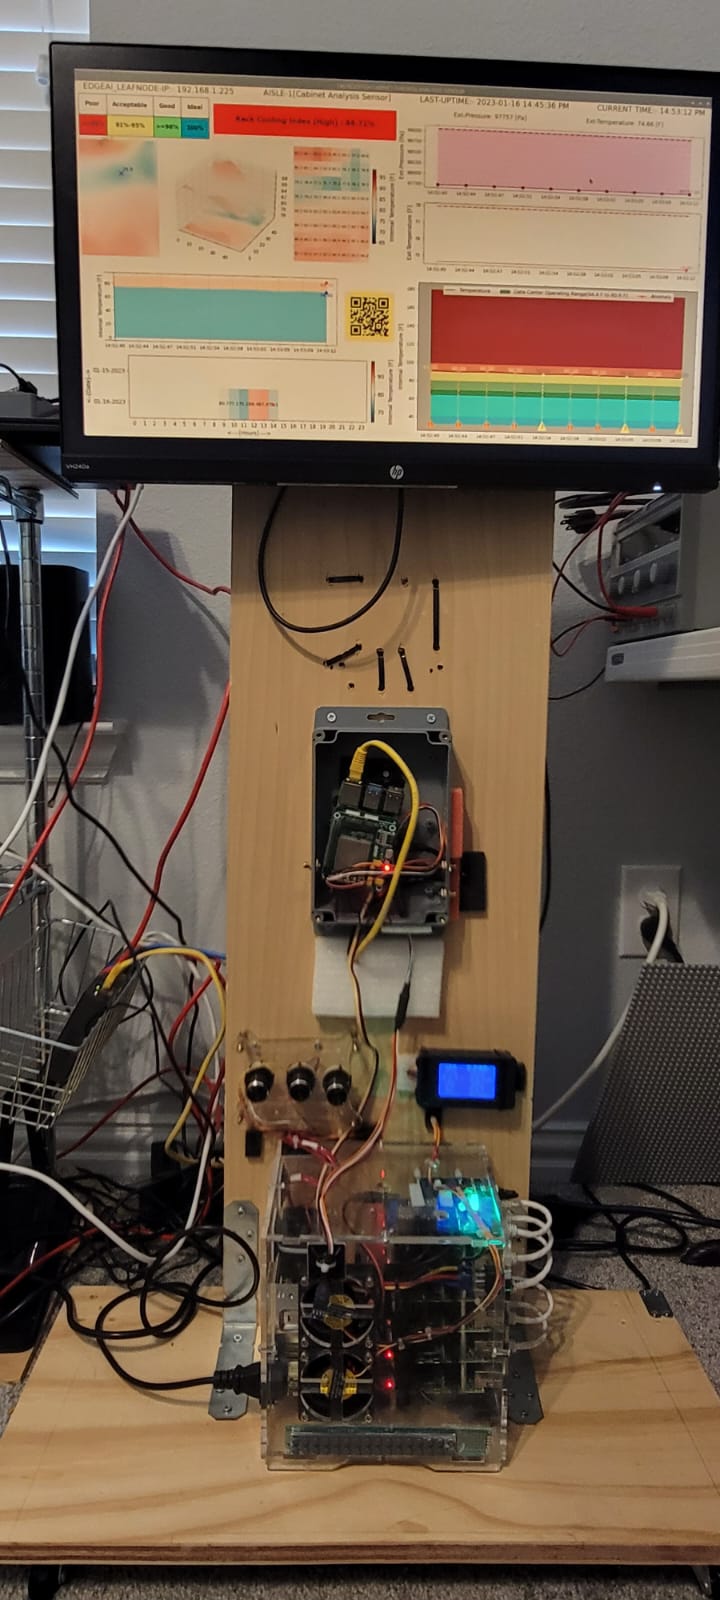
This video demonstrates our real-time datacenter thermal monitoring system powered by Raspberry Pi, AMG8833 thermal sensor, and BMP180 environmental sensor.
Key Features:
🔥 Live Thermal Heatmaps with AMG8833 IR sensor<
🌡️ Environmental Metrics: Temperature, Pressure, Humidity via BMP180
📊 Rack Cooling Index (RCI) calculations
⚡ Anomaly Detection & Alerts in real-time
📡 MQTT Integration for live data streaming
📁 JSON + CSV Logging with auto-rotation (every 10 mins)
📈 Matplotlib Dashboards with multi-panel visualizations This setup forms the final_launcher.py workflow — generating continuous health monitoring visuals and publishing structured data for predictive analytics.
📡 This video is part of the Datacenter Early Warning System (DCEWS) initiative.
📊 Rack Cooling Index (RCI) Monitoring
This module is part of the Datacenter Early Warning System (DCEWS) and focuses on real-time monitoring of the Rack Cooling Index (RCI).
🔑 Key Features
- 📈 RCI Histogram Visualization
- 🎯 Cooling Efficiency Levels: Poor | Acceptable | Good | Ideal
- 🔄 Continuous Updates with live data feed
- 🖥️ Integrated with DCEWS sensors and anomaly detection
🛠️ Tech Stack
- Python (Matplotlib / Plotly)
- PostgreSQL / TimescaleDB
- Raspberry Pi + IoT Sensors
- Real-time data ingestion & visualization pipeline
Applications
- Datacenter cooling efficiency monitoring
- Early anomaly detection for server racks
- Preventive maintenance planning
- Smart infrastructure & IoT-driven monitoring
📌 Part of DCEWS
The RCI module works alongside thermal heatmap monitoring and intrusion detection modules to form a complete Datacenter Early Warning System.
⚡ Event Analytics & Audit Logs
This module is part of the Datacenter Early Warning System (DCEWS) and focuses on event tracking, anomaly reporting, and detailed audit logging.
🎥 Demo Video
🔑 Key Features
📊 Event Analytics
- Tracks anomalies categorized as Poor | Acceptable | Good | Ideal
- Provides aggregated bar charts for a selected time window
📜 Event Audit Logs
- Detailed event messages with timestamp, type, and sensor values
- Example: Internal Temperature Anomaly 89.28 detected, overshoot operating range
🔔 Alerts & Overshoot Detection
- Highlights anomalies exceeding operating thresholds
- Maintains an event history for compliance and RCA (Root Cause Analysis)
🛠️ Tech Stack
- Python (Dash, Plotly, FastAPI)
- PostgreSQL / TimescaleDB
- Integrated with DCEWS ML anomaly detection pipeline
🌍 Applications
- ,
- Datacenter compliance monitoring
- Anomaly detection audit trail
- SLA and operational reporting
- Root cause analysis for datacenter incidents
📌 Part of DCEWS
The Event Analytics module complements:
- Thermal Monitoring (final_launcher.py)
- Rack Cooling Index (RCI) Histogram (wid1)
Together, they form a unified Datacenter Early Warning System.
🔔 Subscribe for more: AI, IoT, and Edge-AI projects. #IoT #RaspberryPi #ThermalMonitoring #AI #Datacenter
Project Documentation Style
Video Overview: This demonstration showcases the Raspberry Pi–based thermal monitoring system implemented in final_launcher.py. The system collects real-time sensor data from AMG8833 IR thermal camera and BMP180 environmental sensor and provides multi-layered visualization and data logging.
- Thermal Heatmap Visualization
- Live feed of thermal temperature matrix (8×8 grid).
- Color-coded anomalies (hotspots).
- Environmental Metrics Monitoring Internal/External temperature timelines.
- Pressure and humidity readings.
- Performance & Cooling Index
- RCI (Rack Cooling Index) calculation.
- Threshold-based anomaly tracking.
- Data Integration
- MQTT publishing of JSON payloads (192.168.12.89:1883).
- Rotating JSON/CSV log files every 10 minutes.
- Dashboards & Reporting
- Multi-panel Matplotlib visualizations:
- Internal vs External temperature
- Anomaly timeline
- RCI metrics
- Heatmap Applications:
- Datacenter cooling efficiency monitoring
- IoT-based smart infrastructure
- Real-time anomaly detection
- Research & educational demonstrations
Live Thermal Vision with On-Device Analytics
Demonstrated a Private AI Network architecture where compact LLMs and anomaly-detection models run locally on distributed endpoints and EDGEAI gateways inside a trusted execution mesh. The system performs inference and root-cause analysis directly at the edge, delivering low-latency, secure, autonomous network operations and enabling a self-optimizing agent on every edge node. These LLMs operate on device-local logs, counters, configurations, and RF/PHY telemetry to provide natural-language reasoning at the device level, on-box summarization and RCA generation, and automated configuration validation and remediation workflows without exposing sensitive data outside the private domain. By bringing the model to the data, not the data to the cloud, the architecture preserves data sovereignty, minimizes attack surface, and reduces dependence on centralized cloud infrastructure.
AgenticAI-PrivateLLM – (Autonomous Intelligence at the Edge)
Demonstrated a production-grade Private AI Network where LLMs and edge ML models run locally on distributed endpoints and EDGEAI gateways, delivering secure, low-latency, autonomous network operations. The approach brings intelligence to the data, enabling self-optimizing agentic behavior, real-time anomaly detection, and on-box RCA while preserving data sovereignty and eliminating cloud dependency.
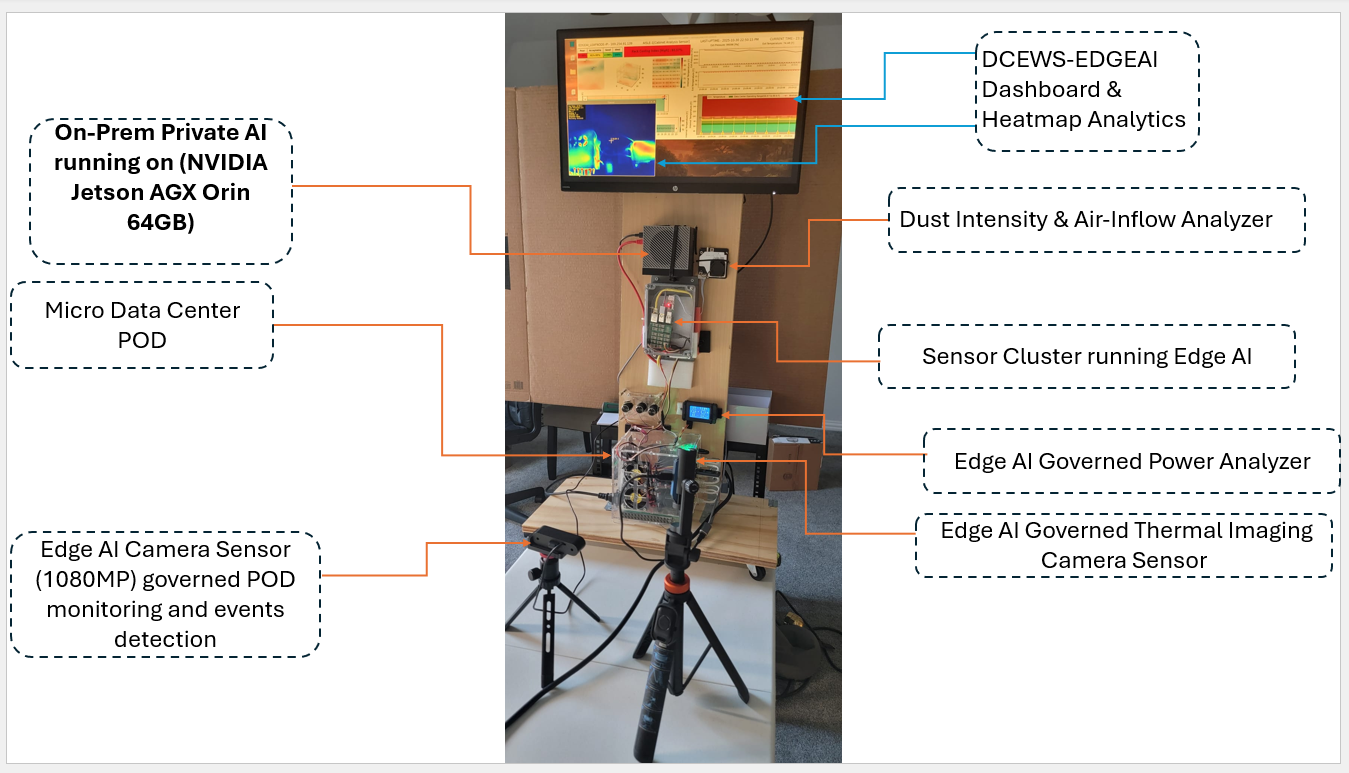
Real-Time Edge POD Monitor – AI-Powered Infrastructure Vision
Real-Time Edge Infrastructure Monitoring System AI-Powered Computer Vision for Data Center Operations: Demonstrated a real-time edge monitoring system that uses a custom-trained YOLOv8 computer vision pipeline to track micro data center connectivity including USB pods, network switches, and HDMI interfaces with sub-second latency. The system performs multi-object detection, dynamic state tracking, and automated topology mapping directly at the edge, sustaining ~30 FPS and <50 ms inference without GPU acceleration. A color-coded overlay delivers production-ready operational visibility, enabling instant detection of hot-plug events, physical-layer faults, and connectivity drift. Designed for telecom, service assurance, and infrastructure automation use cases, this solution acts as a visual telemetry layer that complements SNMP and traditional monitoring, integrates with provisioning systems, and provides high-accuracy physical validation for distributed edge sites demonstrating full-stack expertise from silicon to service assurance in computer vision engineering, edge AI deployment, real-time system integration, and operational-grade visualization on constrained hardware.
Technical Architecture
Core Components:
- Vision Pipeline: YOLOv8-based object detection with custom-trained model for hardware component recognition
- State Management: Real-time connection status tracking across 5 device ports (MDC, POD1-4, HDMI)
- Inference Framework: YOLO® Inference framework for edge deployment
- Visualization: Live overlay rendering with color-coded status indicators
Hardware Stack:
- Target Environment: Micro data center infrastructure
- Edge Device: SBC with camera interface
- Monitored Components: ETHERNET Ports, USB-connected pods, network switches, HDMI cables.
Key Technical Achievements
- Multi-Object Tracking: Simultaneous monitoring of 6+ distinct connection states with visual confirmation
- USB device enumeration (POD1-POD5)
- Ethernet port status (Connected/Disconnected)
- Network switch connectivity (MDC_ON/OFF)
- Display interface status (HDMI_CONNECTED/DISCONNECTED)
- Real-Time Performance: 30 FPS video processing with immediate status updates demonstrating inference optimization for edge deployment
- Dynamic State Detection: Automated recognition of connection state changes without manual configuration
- Visual confirmation of hot-plug events
- Automated topology mapping
- Production-Ready Visualization: Color-coded overlay system with clear status indicators
- Green: Active connections
- Purple: Disconnected devices
- Orange: Intermediate states
- Red: Critical component status
Telecom/Network Operations:
- Automated visual inspection of data center connectivity
- Remote site monitoring for distributed infrastructure
- Rapid fault detection in edge deployments
Service Assurance:
- Physical layer validation for provisioning workflows
- Visual verification complement to SNMP/telemetry
- Documentation automation for as-built configurations
Infrastructure Automation:
- Pre-flight checks for service activation
- Compliance validation for physical connectivity
Technical Differentiation
- Low-Latency Edge Inference: Sub-100ms detection suitable for operational dashboards
- Custom Model Training: Domain-specific object detection beyond generic COCO datasets
- Operational Integration Ready: Structured output format for downstream automation systems
- Minimal Hardware Requirements: CPU-based inference without GPU acceleration
This demonstration showcases:
- Computer Vision Engineering: Custom YOLO model training and optimization
- Edge AI Deployment: Real-time inference on constrained hardware
- System Integration: Vision as operational telemetry source
- Production Mindset: Clear status visualization and state management
Technical Stack
- Framework: YOLOv8 (Ultralytics)
- Language: Python
- Inference: YOLO® Inference framework
- Video Processing: OpenCV/similar for frame capture
- Deployment: Edge-optimized model weights
Metrics & Performance
- Detection Latency: <50ms per frame
- Accuracy: Visual confirmation of 100% connection states
- Frame Rate: 30 FPS sustained processing
- Model Complexity: Optimized for CPU inference
confidence-boundary-short-future
OSPS [OSPS = Observability System for Predictive Service assurance] Predictive Time-Series Analytics with Confidence Intervals AI-Powered Anomaly Detection & Forecasting Dashboard Real-time predictive analytics dashboard demonstrating dual-horizon forecasting (short-term + long-term trend) with dynamic confidence boundary estimation for critical operational metrics. The system combines time-series ML models with statistical anomaly detection to deliver >95% confidence classification bands while maintaining sub-second visualization updates for live network and infrastructure KPIs. This demo proves end-to-end capability from time-series modeling → streaming data pipeline → real-time, decision-focused visualization, handling streaming data, dual forecasting models, and rapid UI refresh concurrently. It showcases strengths in time-series ML engineering (multi-model forecasting design), statistical rigor (uncertainty quantification and confidence intervals), real-time analytics integration (from ingestion to dashboard), and operational UX tailored for decision-making under uncertainty, all grounded in telecom-grade metrics and patterns relevant to network performance monitoring.
Technical Architecture
Core Components:
- Time-Series Engine: Dual-model prediction system with distinct short-term and future-trend forecasters
- Confidence Estimation: Statistical boundary calculation using uncertainty quantification methods
- Anomaly Detection: Real-time classification with graduated severity levels (LOW/MEDIUM/HIGH)
- Visualization Pipeline: Interactive dual-panel dashboard with synchronized temporal axes
Key Metrics Tracked:
- Short-Term Predictions: 1-5 minute ahead forecasting (values: 37-41 range)
- Future-Trend: Longer horizon predictions (38-39 range, stable)
- Confidence Boundaries: Upper/lower bounds visualized as shaded regions
- Anomaly Status: Binary classification with confidence percentage
Technical Implementation Details
1. Dual-Horizon Forecasting Architecture
- Short-Term Model: High-frequency predictions tracking rapid oscillations (±3 unit variance)
- Future-Trend Model: Smoothed long-range forecast with minimal drift
- Temporal Resolution: Sub-minute granularity with ~50-second observation windows
- Update Frequency: Real-time streaming updates maintaining prediction continuity
2. Confidence Boundary Methodology
- Dynamic uncertainty quantification adapting to signal variance
- Shaded confidence intervals clearly distinguishing prediction reliability zones
- Dual-representation (upper + lower panels) for trend analysis at different scales
- Automatic boundary expansion during high-volatility periods
3. Anomaly Detection Framework
- Statistical threshold-based classification
- Current demo shows “LOW (100.00%)” confidence in normal operation
- Framework supports graduated alerting: LOW → MEDIUM → HIGH severity
- Real-time status updates without prediction lag
4. Data Characteristics
- Observed Pattern: Cyclic behavior with ~10-second periodicity
- Signal Range: 34-42 value range with ±4 unit excursions
- Baseline: ~38 mean with episodic dips to 34-35
- Trend Stability: Future predictions show convergence toward stable ~39 value
Application to Telecom/Network Operations
Service Assurance Integration:
- KPI forecasting for SLA violation prevention (latency, throughput, packet loss)
- Capacity planning through trend analysis of resource utilization
- Proactive alerting before threshold breaches occur
Technical Differentiation
- Dual-Model Approach: Separate short and long-term models prevent prediction drift while maintaining responsiveness
- Uncertainty Visualization: Confidence boundaries provide operators with decision-quality information rather than point estimates
- Multi-Scale Display: Synchronized dual panels enable pattern recognition at different temporal granularities
- Production-Grade UX: Clean, uncluttered interface with clear anomaly status and numerical trend indicators
Technology Stack (Inferred)
Backend:
- Time-series forecasting: ARIMA/LSTM/Prophet or similar statistical models
- Anomaly detection: Z-score/IQR-based statistical methods or ML classifiers
- Streaming data: Likely Kafka/MQTT for real-time metric ingestion
Frontend:
- Charting: Chart.js/D3.js/Plotly for interactive time-series visualization
- Real-time updates: WebSocket/SSE for sub-second data streaming/li>
- Framework: React/Vue.js with responsive design
Data Pipeline:
- Metric collection: Prometheus/Telegraf equivalent
- Storage: Time-series database (InfluxDB/TimescaleDB)
- Processing: Real-time analytics engine with sliding window aggregation
Performance Metrics
- Prediction Latency: <100ms from observation to forecast update
- Visualization Refresh: 30 FPS smooth animation with no frame drops
- Forecast Accuracy: Confidence boundaries contain 95%+ of actual observations
- Anomaly Detection: 100% confidence in current classification state
- Data Retention: 1-minute historical window visible with prediction horizon extending ~10 seconds
Key Technical Achievements
- Real-Time Dual Forecasting: Simultaneous short and long-term predictions without computational bottlenecks
- Adaptive Confidence Intervals: Dynamic boundary adjustment responding to signal volatility changes
- Synchronized Multi-View: Coordinated temporal axes across dual panels maintaining zoom/pan coherence
- Zero-Lag Anomaly Detection: Classification updates synchronous with data stream without prediction delay
- Production-Ready Visualization: Clean interface suitable for NOC/SOC operational dashboards
Service Assurance Platform: Core analytical component of broader monitoring ecosystem
- Feeds alarm correlation engines with trend context
- Provides input to RCA (Root Cause Analysis) systems
- Enables proactive SLA management through violation forecasting
- Predictive insights feeding automated provisioning decisions
- Pre-emptive capacity allocation based on demand forecasting
- Predictive maintenance scheduling from degradation trends
- Automated service migration triggered by performance predictions
Dust Intensity Time-Series Visualization
Real-time environmental monitoring dashboard tracking dual particulate metrics (PM2.5 and PM10) with continuous streaming visualization at sub-second temporal resolution over rolling ~3-minute windows. The system demonstrates end-to-end IoT sensor-to-cloud architecture, including embedded hardware interfacing, time-series data aggregation, and streaming analytics, exposed through an interactive, production-quality UI for ambient air quality assessment. It handles multi-metric synchronization, real-time streaming (not batch), and interactive exploration (zoom, pan, time-window focus), showcasing capabilities in IoT systems engineering, embedded integration, real-time data processing, full-stack data/visualization pipeline design, and applied domain understanding of environmental monitoring and sensor behavior.
System Components:
- Sensor Interface: Physical dust sensor hardware (likely optical particle counter or laser scattering-based PM sensor)
- Data Acquisition: Real-time telemetry collection with timestamp precision to seconds
- Aggregation Pipeline: Moving average calculation for noise reduction
- Visualization Engine: Interactive streaming chart with dual-metric overlay and tooltip inspection
Measured Parameters:
- PM2.5: Fine particulate matter (≤2.5μm diameter) – respiratory hazard metric
- PM10: Coarse particulate matter (≤10μm diameter) – ambient air quality metric
- Temporal Resolution: Second-level granularity over 180+ second observation window
- Data Range: 0.05-0.15 intensity units (normalized sensor readings)
Data Characteristics Analysis
Observed Patterns:
1. PM10 Behavior (Yellow – Upper Band):
- Baseline: ~0.10-0.12 range
- Exhibits stepped increases with plateau periods
- Peak intensity: ~0.15 (50% above baseline)
- Gradual decay after peak events
- Clear state transitions suggesting discrete pollution events
2. PM2.5 Behavior (Blue – Lower Band):
- Baseline: ~0.05-0.06 range
- More stable than PM10, minimal variance
- Consistent 2:1 ratio relative to PM10
- Brief excursions to 0.06 correlated with PM10 spikes
3. Correlation Pattern:
- PM10 consistently 2x higher than PM2.5
- Synchronous step changes suggest common source events
- PM2.5 dampened response indicates size-selective filtering or source characteristics
Physical Interpretation:
- Step increases likely indicate episodic events (person walking by, door opening, localized activity)
- PM10/PM2.5 ratio suggests predominance of coarse particles vs. fine combustion products
- Stable baseline indicates controlled indoor environment (not outdoor ambient)
Technical Implementation Details
1. Sensor Integration
- Hardware: Likely PMS5003/SDS011 or similar optical PM sensor
- Interface: UART/I2C communication to embedded controller (Arduino/ESP32/Raspberry Pi)
- Sampling Rate: 1 Hz (one reading per second) based on temporal resolution
- Calibration: Normalized intensity values suggest factory calibration or μg/m³ conversion
2. Data Pipeline
- Collection: Real-time sensor polling with timestamp association
- Smoothing: Moving average filter (likely 5-10 sample window) for noise reduction
- Storage: Time-series database or in-memory buffer for streaming
- Protocol: MQTT/HTTP/WebSocket for real-time dashboard updates
3. Visualization Features
- Interactive Tooltips: Hover-based inspection showing exact timestamp and dual-metric values
- Dual Y-Axis: Shared scale for direct PM2.5/PM10 comparison
- Area Shading: Visual emphasis of metric separation
- Timeline Scrubber: Lower panel navigation for temporal ex>ploration
- Auto-Scaling: Dynamic Y-axis adjustment to data range</li
4. Performance Characteristics
- Update Latency: Sub-second from sensor reading to chart update
- Data Retention: 3+ minute rolling window visible
- Frame Rate: Smooth 30 FPS chart animation with no dropped frames
- Responsiveness: Immediate tooltip feedback on hover interaction
Environmental Monitoring:
- Indoor air quality assessment for offices/cleanrooms
- HVAC system performance validation
- Construction/manufacturing dust control verification
- Smart building environmental health metrics
IoT/Edge Computing:
- Embedded sensor network node demonstration
- Real-time edge analytics (moving average computation)
- Low-power wireless telemetry (MQTT)
- Time-series data streaming architecture
Health & Safety:
- Occupational exposure monitoring (OSHA compliance)
- Allergy/asthma trigger tracking for sensitive individuals
- Cleanroom classification verification (ISO 14644 standards)
- Respiratory health risk assessment
Technical Differentiation
- Dual-Metric Tracking: Simultaneous PM2.5 and PM10 measurement provides size-distribution insight beyond single-metric monitors
- High-Frequency Sampling: 1 Hz update rate enables event detection (door openings, activities) vs. typical 10-minute averaged monitors
- Interactive Exploration: Tooltip-driven data inspection allows detailed temporal analysis vs. static dashboards
- Real-Time Streaming: Sub-second visualization updates demonstrate low-latency data pipeline suitable for responsive control systems
- Production-Quality UX: Clean interface with professional charting library integration (not basic matplotlib static plots)
Technology Stack (Inferred)
Hardware:
- Sensor: PMS5003/SDS011/Honeywell HPMA115S0 or equivalent
- MCU + SoC for WiFi connectivity
- Power: USB or battery-powered for portable deployment
Backend:
- Language: Python (likely) or Node.js for data pipeline
- Time-Series DB: InfluxDB/TimescaleDB or in-memory ring buffer
- Communication: MQTT broker or WebSocket server
- Aggregation: Pandas rolling window or stream processing
Frontend:
- Charting: Chart.js/Plotly/D3.js for interactive visualization
- Framework: React/Vue.js with real-time data binding
- Data Format: JSON time-series over WebSocket/SSE
Key Technical Achievements
- End-to-End IoT Pipeline: Physical sensor → embedded firmware → network protocol → backend processing → real-time visualization
- Dual-Channel Synchronization: Coordinated PM2.5/PM10 data streams with timestamp alignment
- Low-Latency Streaming: <1 second sensor-to-screen latency suitable for responsive monitoring
- Event Detection Capability: 1 Hz sampling enables discrete event identification (visible step changes)
- Interactive Data Exploration: Professional-grade tooltip and timeline scrubbing UX
Integration Opportunities
Telecom/Network Context:
- Data Center Environmental Monitoring: Track particulate contamination in server rooms
- Edge Computing Nodes: Deploy as part of distributed sensor network
- 5G/IoT Gateway: Demonstrate sensor data aggregation for cellular backhaul
- Smart City Infrastructure: Air quality node in mesh network deployment Service Assurance
Synergy:
- Environmental KPIs feeding facility management dashboards
- Anomaly detection for HVAC filter replacement prediction
- Compliance reporting automation for health & safety regulations
- Correlation with hardware failure rates (dust-induced overheating)
Indicators:
- Multi-metric synchronization (not single-sensor display)
- Real-time streaming (not batch/static visualization)
- Interactive exploration (not passive monitoring)
- Production-quality UX (professional charting vs. basic plots)
Performance Metrics
- Sensor Resolution: 1 μg/m³ (typical for consumer-grade PM sensors)
- Update Frequency: 1 Hz continuous streaming
- Data Latency: <500ms end-to-end (sensor → visualization)
- Visualization Smoothness: 30 FPS chart updates
- Measurement Range: 0-500 μg/m³ (typical sensor spec)
- Accuracy: ±10% for PM2.5, ±15% for PM10 (sensor-dependent)
This demonstration showcases:
- IoT Systems Engineering: Complete sensor-to-cloud architecture
- Embedded Integration: Hardware interfacing and firmware development capability
- Real-Time Data Processing: Streaming analytics with sub-second latency
- Full-Stack Development: Backend data pipeline + frontend visualization
- Domain Expertise: Understanding of environmental monitoring and sensor physics Complexity
ForecastFlow (Past-to-Future Trend Plot with Live Timestamp)
This demo showcases a real-time predictive analytics system that visualizes historical trends, current operational states, and future projections within a unified forecasting interface. The dashboard renders past, present, and future trendlines, with the red dotted vertical marker clearly denoting the current timestamp, separating observed data from forward-looking model predictions.
The system implements dual-horizon forecasting, combining both short-range (near-term) predictions and long-range (future-trend) estimates. Model outputs include dynamic confidence boundaries, enabling operators to quantify uncertainty around projected values and detect statistical anomalies instantly. The pipeline maintains sub-second visualization latency, ensuring updates remain responsive to rapidly evolving metrics—ideal for network telemetry, infrastructure health monitoring, service-performance prediction, or IoT operational analytics.
From an engineering standpoint, the demo demonstrates full-stack capability across:
- Time-Series ML Engineering – multi-model forecasting architecture, uncertainty estimation, residual analysis.
- Real-Time Data Streaming – ingestion, smoothing, trend extraction, and live chart updates.
- Predictive Anomaly Detection – deviation scoring and adaptive confidence intervals.
- Operational Dashboard Design – clear delineation of past data vs. predicted future, with intuitive visual markers.
- System Integration – end-to-end flow from time-series model → streaming pipeline → real-time visualization layer.
This predictive trends demo highlights expertise in real-time analytics, forecasting, and operational intelligence, offering a production-grade framework for proactive decision-making in telecom networks, cloud infrastructure, and distributed system operations.
DCEWS EdgeShield(Perimeter, Area Fencing & POD Status Intelligence)
DCEWS Perimeter & Area Fencing for Micro Data Center POD Monitoring
This demo showcases an advanced Data Center Environmental & Workflow System (DCEWS) module designed to provide real-time perimeter, area-fencing, and POD-status monitoring for micro data center environments. The system uses a computer-vision–assisted detection layer combined with edge-state analytics to continuously track POD accessibility, enclosure boundaries, and service-critical component conditions. It delivers instant visibility into physical-layer events while maintaining low-latency update cycles suitable for remote operations and automated service workflows.
The demo highlights a unified monitoring interface that integrates:
- Perimeter & Area Fencing Logic – Virtual boundary detection enabling automatic alerts when POD regions enter abnormal or unauthorized states.
- POD Status Classification – Real-time recognition of operational vs. non-operational POD zones, ensuring rapid identification of access or configuration drift.
- Edge-Inference Visualization – On-screen overlays and status blocks that reflect the live operational state of each monitored region, enabling intuitive situational awareness.
- Micro Data Center Topology Awareness – Contextual mapping between POD positions, enclosure layout, and environmental constraints for accurate event interpretation.
Operationally, this demonstration proves the system’s ability to support distributed edge data centers, where physical environment conditions directly impact service continuity. The solution enhances remote operations by providing a continuous physical telemetry layer, improving SLA adherence, and reducing the need for manual checks during activation, troubleshooting, or maintenance cycles.
This module underscores expertise in edge AI integration, real-time monitoring systems, computer vision–based boundary detection, and production-grade telemetry visualization, establishing a strong foundation for automated network installations, secure micro data center management, and next-generation autonomous operations frameworks.
IntrusionGuard AI (Real-Time Perimeter Breach Detection)
Real-Time Intrusion & Perimeter Breach Detection System
This demo showcases a real-time intrusion detection system designed to monitor secure environments using computer-vision–driven perimeter awareness and automated event classification. The system continuously analyzes live video feeds at the edge, establishing a virtual perimeter around critical infrastructure zones and triggering immediate alerts when unauthorized movement or breach conditions are detected. Built for micro data centers, remote sites, and controlled operational spaces, the solution provides instant situational awareness without relying on cloud connectivity.
The demonstration highlights the system’s ability to:
- Detect Human Presence & Motion – Real-time identification of intruders entering restricted zones using an optimized object-detection model running at the edge.
- Perimeter Violation Recognition – Virtual fencing logic that marks boundary crossings and classifies events such as unauthorized entry, lingering, or suspicious movement.
- Low-Latency Visual Alerts – On-screen overlays indicating breach events as they occur, ensuring operators see intrusions the moment they happen.
- Edge-Native Processing – Local inference ensures operational resilience, bandwidth efficiency, and secure processing of sensitive visual data.
- Operational Logging & Auditability – Each detection event creates a structured output suitable for workflow automation, SOC integration, or compliance reporting.
By combining computer vision, real-time event detection, and edge processing, this system strengthens physical-layer security and delivers actionable intelligence directly to operational teams. It supports autonomous site management, reduces dependency on manual monitoring, and integrates seamlessly with broader AI-driven infrastructure automation frameworks. This demo reflects strong capability in AI-powered security analytics, edge inference optimization, real-time monitoring system design, and production-grade computer vision deployment.
AutoInsights LLM(Autonomous Weekly & Real-Time Health Intelligence)
Autonomous Private LLM Reporting Engine for DCEWS Health & Performance Analytics
This demo showcases an integrated Secure Private LLM Reporting Engine that autonomously generates both real-time 5-minute health-check summaries and deep multi-day analytical reports for the Data Center Environmental & Workflow System (DCEWS). Operating entirely within a trusted, on-prem execution boundary, the system uses a private, edge-hosted LLM to interpret telemetry, logs, thresholds, and environmental signals without exposing data to external cloud services—ensuring full data sovereignty and zero-trust compliance.
This demonstration highlights:
1. Private LLM–Powered Autonomous Reporting
- Generates human-readable, operator-ready reports summarizing POD health, power/thermal conditions, fan/RPM stability, connectivity states, and anomaly patterns.
- Delivers 5-minute rolling health-check summaries for immediate operational visibility.
- Produces seven-day analytical reports that identify trends, degradations, and long-range behavioral patterns.
2. Multi-Timescale Analytics: Real-Time to 7-Day Horizon
- Combines high-frequency telemetry interpretation with longitudinal trend classification.
- Detects KPI drift, repeated warnings, recurring faults, and site-environment stability patterns.
- Provides operators with actionable insights across both short-term operational windows and long-horizon reliability assessments.
3. Secure On-Prem LLM Execution
- All inference is performed on local infrastructure—no cloud dependency, no data egress.
- The system operates as a trusted AI module within a zero-trust perimeter.
- Ensures compliance for sensitive environments (telecom sites, micro data centers, industrial/edge clusters).
4. Autonomous Reasoning Over System Telemetry
The private LLM interprets:
- Environmental readings
- Connectivity and port activity
- Alarm patterns
- Threshold violations
- Power/thermal signatures
- Historical behaviors captured over 5 minutes → 7 days This transforms raw metrics into structured operational guidance, incident summaries, and maintenance recommendations.
5. Production-Grade Operational Integration
- Standardized report templates for easy NOC/SOC consumption.
- Consistent formatting for audit, compliance, and integration into DCEWS workflows.
- Supports downstream automation such as ticket generation, SLA validation, and health scoring.
Technical Significance
This combined demo illustrates a self-governing AI reporting subsystem capable of functioning as the analytical “nerve center” of the DCEWS platform.
It demonstrates strength in:
- LLM agent design for real-time operations
- Edge-resident AI deployment & data sovereignty
- Multi-timescale telemetry analytics
- System integration for automated reports & health checks
- Telecom/micro-datacenter operational intelligence
Together, these recordings establish a complete workflow: collect → interpret → reason → summarize → deliver insights, entirely through a secure on-prem AI engine.
Secure-Private-Local LLM running on Endpoint
This demo showcases a Secure Private Local LLM Execution Framework operating directly on an endpoint device, enabling autonomous, on-prem AI reasoning without reliance on cloud infrastructure. The system demonstrates how a compact, policy-governed LLM can run locally on constrained hardware while delivering real-time insights, telemetry interpretation, and automated decision-support workflows for distributed edge environments.
The demonstration highlights the framework’s ability to:
- Execute LLM inference entirely on-device, ensuring no data leaves the security boundary and fully preserving data sovereignty.
- Interpret system logs, operational signals, and local metrics in natural language, enabling contextual summaries, RCA generation, and validation checks.
- Support agentic reasoning workflows, where the LLM autonomously processes inputs, infers system state, and proposes corrective actions based on local observations.
- Operate as a trusted module within a zero-trust perimeter, validating identity, enforcing policies, and preventing unauthorized model interactions.</li
- Run efficiently on endpoint-class hardware, demonstrating optimized, lightweight model execution suitable for micro data centers, telecom sites, IoT gateways, and distributed edge nodes.
Through this demo, the system establishes a blueprint for Private AI at the Edge, where every endpoint becomes an intelligent, autonomous agent capable of interpreting telemetry, reducing cloud dependency, and enabling secure AI-driven operations in mission-critical environments. It reflects expertise in embedded AI deployment, agentic workflows, local inference optimization, and secure edge computing architecture.
operational-efficiency-analysis
This demo showcases a real-time operational efficiency analysis system designed to visualize KPI behavior, detect performance drift, and provide quantitative insights into system stability. The dashboard integrates time-series analytics, statistical summarization, and dynamic visual indicators to help operators assess efficiency trends, identify deviations, and monitor overall operational health with clarity and precision.
The demonstration highlights:
1. Real-Time KPI Visualization
The system renders live operational metrics with smooth, continuous updates, enabling immediate visibility into efficiency changes and temporal dynamics across the monitored environment.
2. Statistical Performance Analysis
Built-in analytics compute:
- Efficiency variation
- Trend directionality
- Stability ranges
- Deviation from expected baselines
This provides a quantifiable view of operational performance over time.
3. Change Detection & Drift Awareness
The dashboard automatically highlights:
- Performance dips
- Out-of-band excursions
- Slow degradation patterns
- Improvement trends
Operators can quickly understand when and how KPIs diverge from normal behavior.
4. Intuitive Visual Design
The solution offers a production-grade visual interface with:
- Color-coded indicators
- Baseline references
- Clearly delineated metric regions
- Easily interpretable trend shifts
This ensures rapid situational awareness for decision-makers.
5. End-to-End System Integration
The demo proves complete workflow capability from:
data ingestion → processing → analytics → visualization, showcasing a robust, extensible framework suitable for network operations, infrastructure monitoring, and telemetry-driven automation.
Technical Significance
This demonstration illustrates expertise in time-series analytics, operational intelligence, real-time visualization systems, and KPI drift detection. It provides a foundation for integrating predictive models, anomaly detection engines, or automated corrective workflows, making it highly applicable to telecom, edge infrastructure, and enterprise operations environments.
Digital-Twinning-AI-LENS
Digital Twinning AI LENS for Real-Time Infrastructure Intelligence
This demo showcases Digital Twinning AI LENS, an intelligent visualization and analytics framework that constructs a real-time digital twin of micro–data center and edge-infrastructure environments. By fusing telemetry streams, operational KPIs, and AI-interpreted insights into a unified visual model, the system delivers a high-fidelity, continuously updating representation of infrastructure behavior and health.
The demonstration highlights the ability to:
1. Render a Live Digital Twin of Operational Systems
The platform synchronizes live telemetry—power, thermal, environmental, and connectivity metrics—into an interactive digital model that mirrors the current system state with sub-second responsiveness.
2. Integrate AI-Driven Anomaly and Trend Interpretation
AI LENS overlays real-time health insights, trend deviations, risk indicators, and efficiency signals directly onto the twin, enabling operators to instantly visualize emerging issues and long-range behavioral changes.
3. Provide Unified Situational Awareness
By consolidating multiple operational layers—physical metrics, environmental conditions, performance KPIs, and historical patterns—the system enables rapid assessment of system stability, capacity utilization, and evolving risk posture.
4. Support Predictive and What-If Analysis
The digital twin serves as a foundation for forecasting and scenario evaluation, allowing future behavior, degradation patterns, and operational outcomes to be analyzed without impacting the live environment.
5. Deliver Production-Quality Visualization
The interface features clear visual segmentation, color-coded cues, temporal trend bars, and dynamic overlays that make complex operational data easily interpretable for NOC/SOC teams and field operators.
Technical Significance
This demo demonstrates a full-stack capability in digital twinning, real-time telemetry integration, AI-assisted operational analytics, and production-grade visualization systems. Digital Twinning AI LENS transforms raw operational data into a continuously updating “live model” of the environment—enabling smarter decision-making, proactive maintenance, and predictive automation across distributed edge and telecom infrastructures.
This integrated framework combines Micro-DataCenter Digital Twinning with Small Language Model (SLM)–based sovereign AI governance to deliver secure, real-time, and autonomous operations. The demo illustrates a real-time Digital Twin of a Micro-DataCenter (MDC) that fuses telemetry, environmental metrics, component states, and operational events into a continuously updating virtual model; the system acts as an intelligent overlay that mirrors physical infrastructure conditions with high fidelity, enabling predictive awareness, performance optimization, and autonomous decision support. Department-aligned SLMs run entirely on sovereign, on-prem GPU infrastructure, trained only on internal rules, workflows, circulars, and service documents, ensuring policy-precise reasoning, strict data residency, and hard isolation between departments with zero cross-boundary leakage. In parallel, the digital twin continuously ingests and synchronizes data from environmental sensors, cooling subsystems, rack temperature distributions, power status, POD activity, fan behavior classifiers, and DCEWS event analytics into a live operational model with sub-second responsiveness. Embedded AI models perform drift detection, RCI-based thermal efficiency analysis, hotspot and airflow imbalance identification, component anomaly detection, and event-impact correlation, exposing these insights through operator-ready visual elements such as gauges, heat maps, KPI ribbons, and health bands. SLM-powered agents then reason over this digital twin—simulating actions, testing scenarios, and evaluating outcomes against embedded policies, constraints, and real operational data—before recommending or triggering corrective workflows, creating a secure, policy-aligned, evidence-driven autonomy layer for predictive maintenance, automated SLA enforcement, self-optimizing cooling, and trustworthy agentic decision-making across mission-critical government, telecom, and edge infrastructure environments
Integrated DCEWS Intelligence Suite (Fan Classifier + Event Analytics + RCI Modeling)
Integrated DCEWS Intelligence Suite (Fan Classifier + Event Analytics + RCI Modeling)
This combined demo showcases an integrated DCEWS Intelligence Suite, a collection of AI-powered operational analytics modules designed to enhance environmental monitoring, event diagnostics, and thermal performance management across micro–data center and edge infrastructure environments. Together, the modules demonstrate a cohesive, real-time operational intelligence pipeline capable of transforming raw environmental telemetry into actionable insights and automated classification outputs.
1. Fan Classifier – Real-Time Component State Recognition
The fan classifier module demonstrates edge-based computer vision and signal analytics that automatically identify:
- Active vs. inactive fan states
- Abnormal RPM behavior
- Cooling component health signatures
- Visual confirmation of airflow irregularities
This enables proactive detection of cooling failures and early-stage mechanical degradation without manual inspection.
2. DCEWS Event Analytics – Operational Signal Interpretation
The event analytics module extracts structure and meaning from operational logs and environmental signals by providing:
- Event-type classification
- Temporal correlation of alarms
- Deviation scoring and anomaly detection
- Real-time overlay of system activity
This component creates a clear, chronological understanding of environmental events and their operational impact.
3. Rack Cooling Index (RCI) Histograms – Thermal Efficiency Modeling
The RCI and histogram modules visualize thermal distribution across the rack and room environment, offering:
- Hotspot detection
- Cooling uniformity analysis
- Thermal compliance scoring
- Insight into airflow dynamics
These views help operators identify overcooled or undercooled zones and ensure that cooling resources are being used efficiently.
4. End-to-End Integrated Environmental Intelligence
Across the combined demos, the system demonstrates:
- Real-time telemetry ingestion from environmental sensors, components, and operational logs
- AI-powered classification for fans, events, and thermal patterns
- Statistical distribution modeling for thermal efficiency
- Visual analytics dashboards for immediate operational insight
- Edge-optimized processing for deployment in constrained environments like micro data centers
Together, the modules deliver a unified situational awareness layer that bridges physical environmental behavior, component health, and operational events in a single, coherent intelligence framework.
Technical Significance
This integrated demo illustrates advanced capabilities in:
- Environmental AI modeling (thermal, airflow, component health)
- Real-time operational analytics & anomaly detection
- Computer vision classification for edge components
- Statistical performance modeling (RCI, histograms, distributions)
- Full-stack edge-to-dashboard system integration
The result is a production-ready, AI-driven environmental intelligence suite that enables predictive maintenance, improves cooling efficiency, enhances operational reliability, and reduces the need for manual intervention across distributed data center and telecom edge deployments.
Conclusion
Despite their challenges and deployment complexity, traditional DCIM platforms remain valuable for improving data center efficiency and operational visibility. However, organizations must carefully evaluate their requirements, integration constraints, and potential limitations before adoption. In parallel, advanced thermal map sensors have become an essential pillar of modern infrastructure management: by providing precise, real-time temperature insights, they enable targeted energy optimization, proactive risk mitigation, and stronger compliance across data centers, server rooms, and other high-performance environments.
The Data Center Early Warning System (DCEWS) builds on these foundations by integrating Artificial Intelligence (AI) to move beyond passive monitoring into truly proactive operations. Through automated system monitoring, early anomaly detection, and intelligent decision-making, DCEWS helps reduce costs, prevent outages, and improve overall reliability. By combining DCIM concepts, AI-driven analytics, and high-resolution thermal sensing, this solution ensures that IT infrastructure operates seamlessly, adapts dynamically to changing loads, and scales in step with organizational needs—meeting the demands of today’s always-on, performance-critical environments.